Context:
In the past I’ve written up several posts about working with Sparkplug B messages in Node-RED. Even though they’re easy to read in with the built-in MQTT core node, decoding them is the tricky part (see this thread: Decode Sparkplug Encoded MQTT Messages with Node-RED).
When it comes to sending messages, that gets a bit harder, but is doable – see this thread for that side of things: Sending MQTT Sparkplug B control messages from Node-RED
But Sparkplug B compliance involves much more than just reading and writing protobuf encoded MQTT messages, you can read the full specifications, but the important things are state management, message types, and payload format.
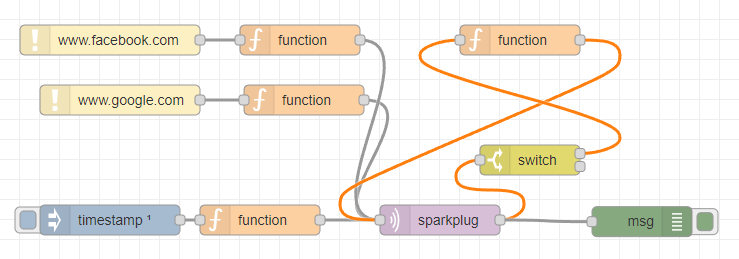
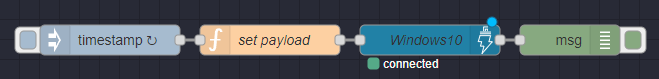
There has been a node-red-contrib-sparkplug package for Node-RED, but it’s always been “rather difficult” to set up and use. Yes, that’s a figure-8 going out and back into the Sparkplug node…
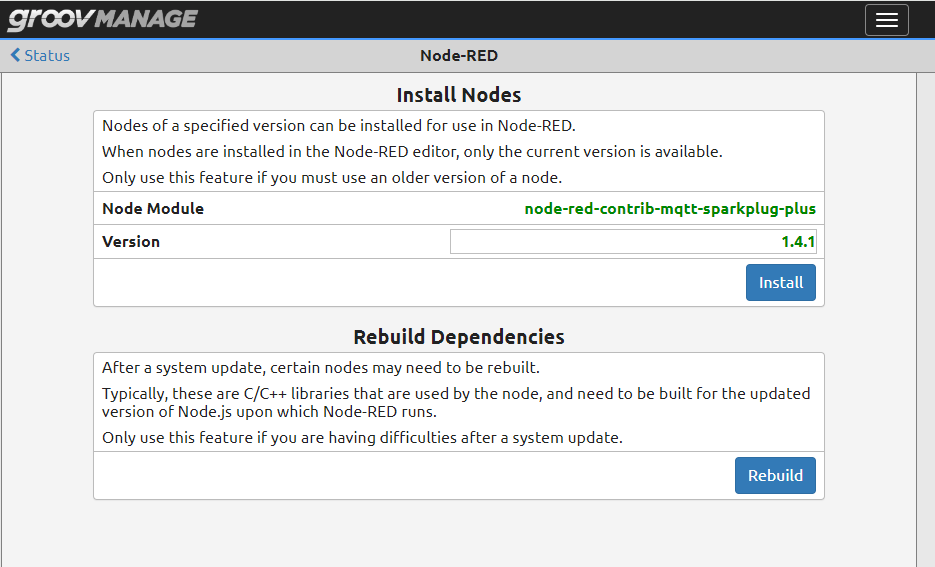
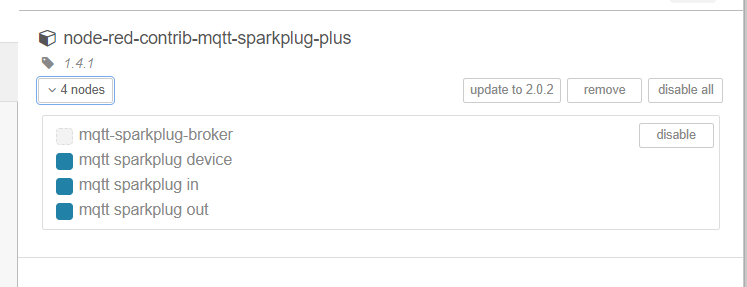
But thankfully there’s a “new” node package out that makes the whole process much easier, and within just a few minutes you can turn any Node-RED instance into a Sparkplug B compliant device with node-red-contrib-mqtt-sparkplug-plus.
The important stuff:
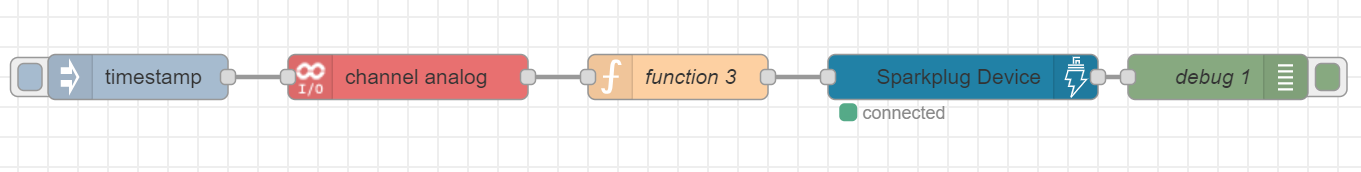
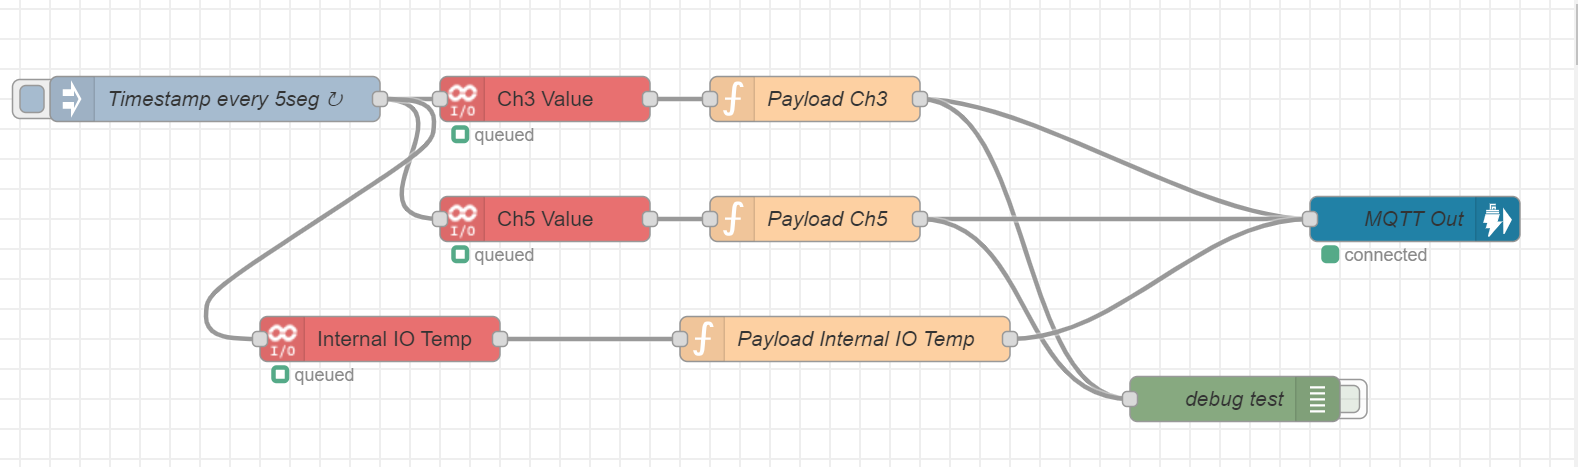
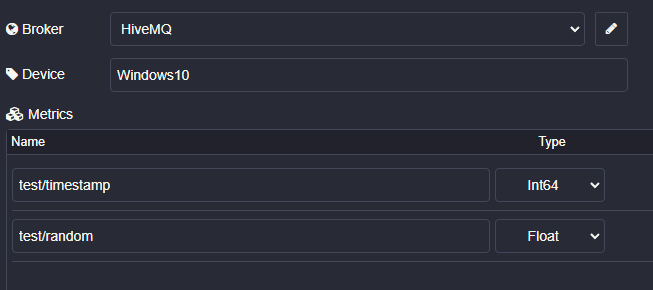
After installing the sparkplug-plus node package it’s super trivial to get started, and everything you need to know is in the help tab for the node. Just drop an instance of the “mqtt sparkplug device” node in, add your broker to the configuration, then head over to the “help” tab with the node highlighted.
You have two options for setting your metrics, you can either hardcode whatever you want to send in the Node configuration yourself, or you can dynamically set them with a msg.definition property any time. The birth, command, and death messages are all handled by the node, and the msg.payload “metrics” array is what triggers your data to be published.
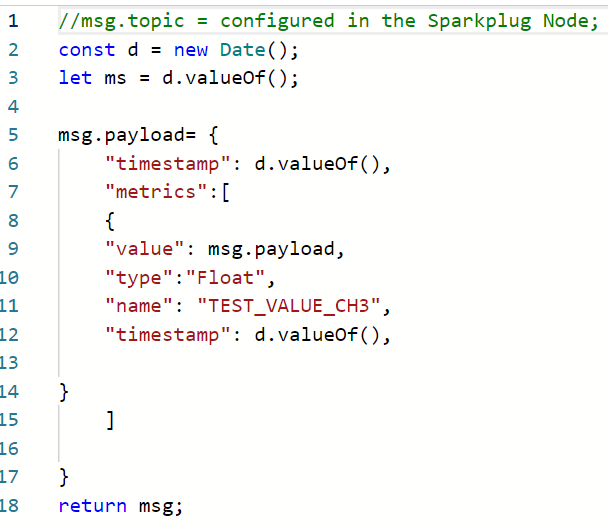
You can create subtopics by using a / in the topic, just like with non-Sparkplug MQTT messages, just follow the same payload format they describe:
msg.payload = {
    "metrics": [
        {
            "name": "testing/test1",
            // Timestamp  is optional.
            "timestamp" : new Date(),
            "value": 11
        },
        {
            "name": "testing/test2",
            "value": 12
        }
    ]
};
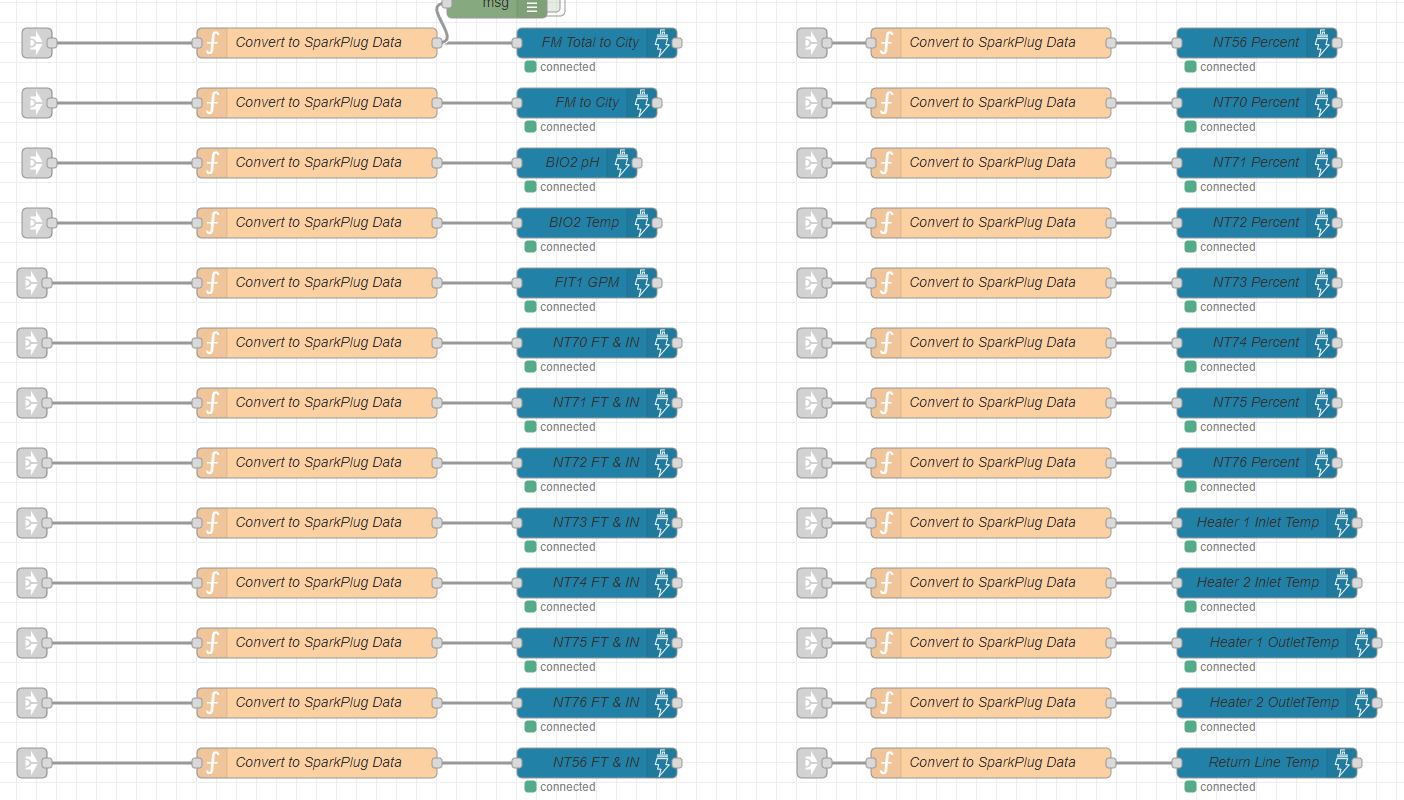
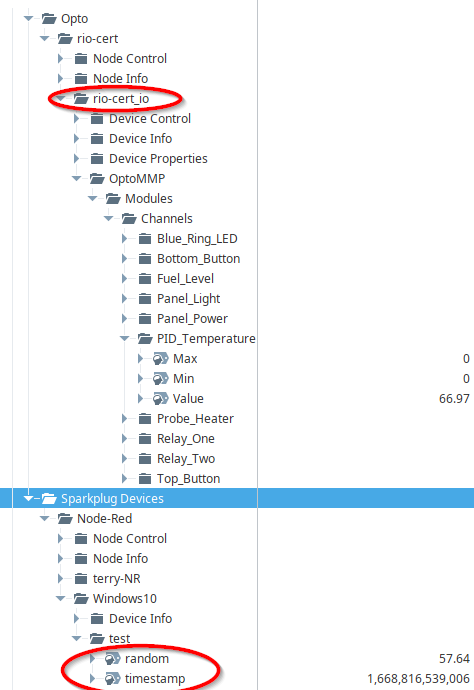
And… that’s it! Using this node I was able to get some data up to my HiveMQ broker (although any broker would work) in just a few minutes. To close the loop and see my data, I decided to bring it open in my Ignition tag browser along side the data coming from my groov EPIC via the built-in Sparkplug B client.
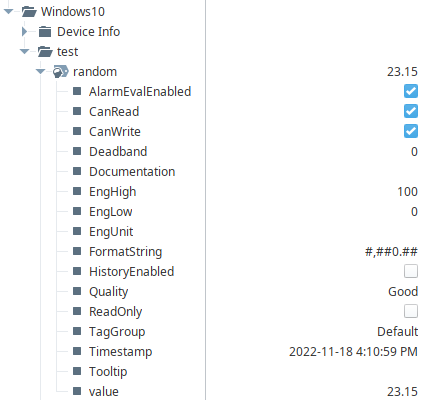
The tags are complete with health and other useful metadata:
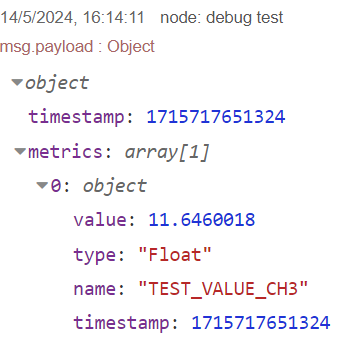
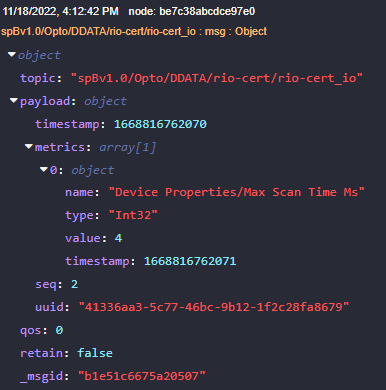
This is just a quick “getting started” and PSA about the existence of this package, but also be aware that you can easily use it to read in and decode Sparkplug B messages without needing to go out and download the protobuf file. Here’s some data from my RIO in the debug pane in Node-RED, via the Sparkplug B client built right into groov Manage (note that I have to provide user credentials that are on the ACL (access control list) for this topic namespace):
If you end up using this in your application, let us know in the thread below! And as always, happy flowing.