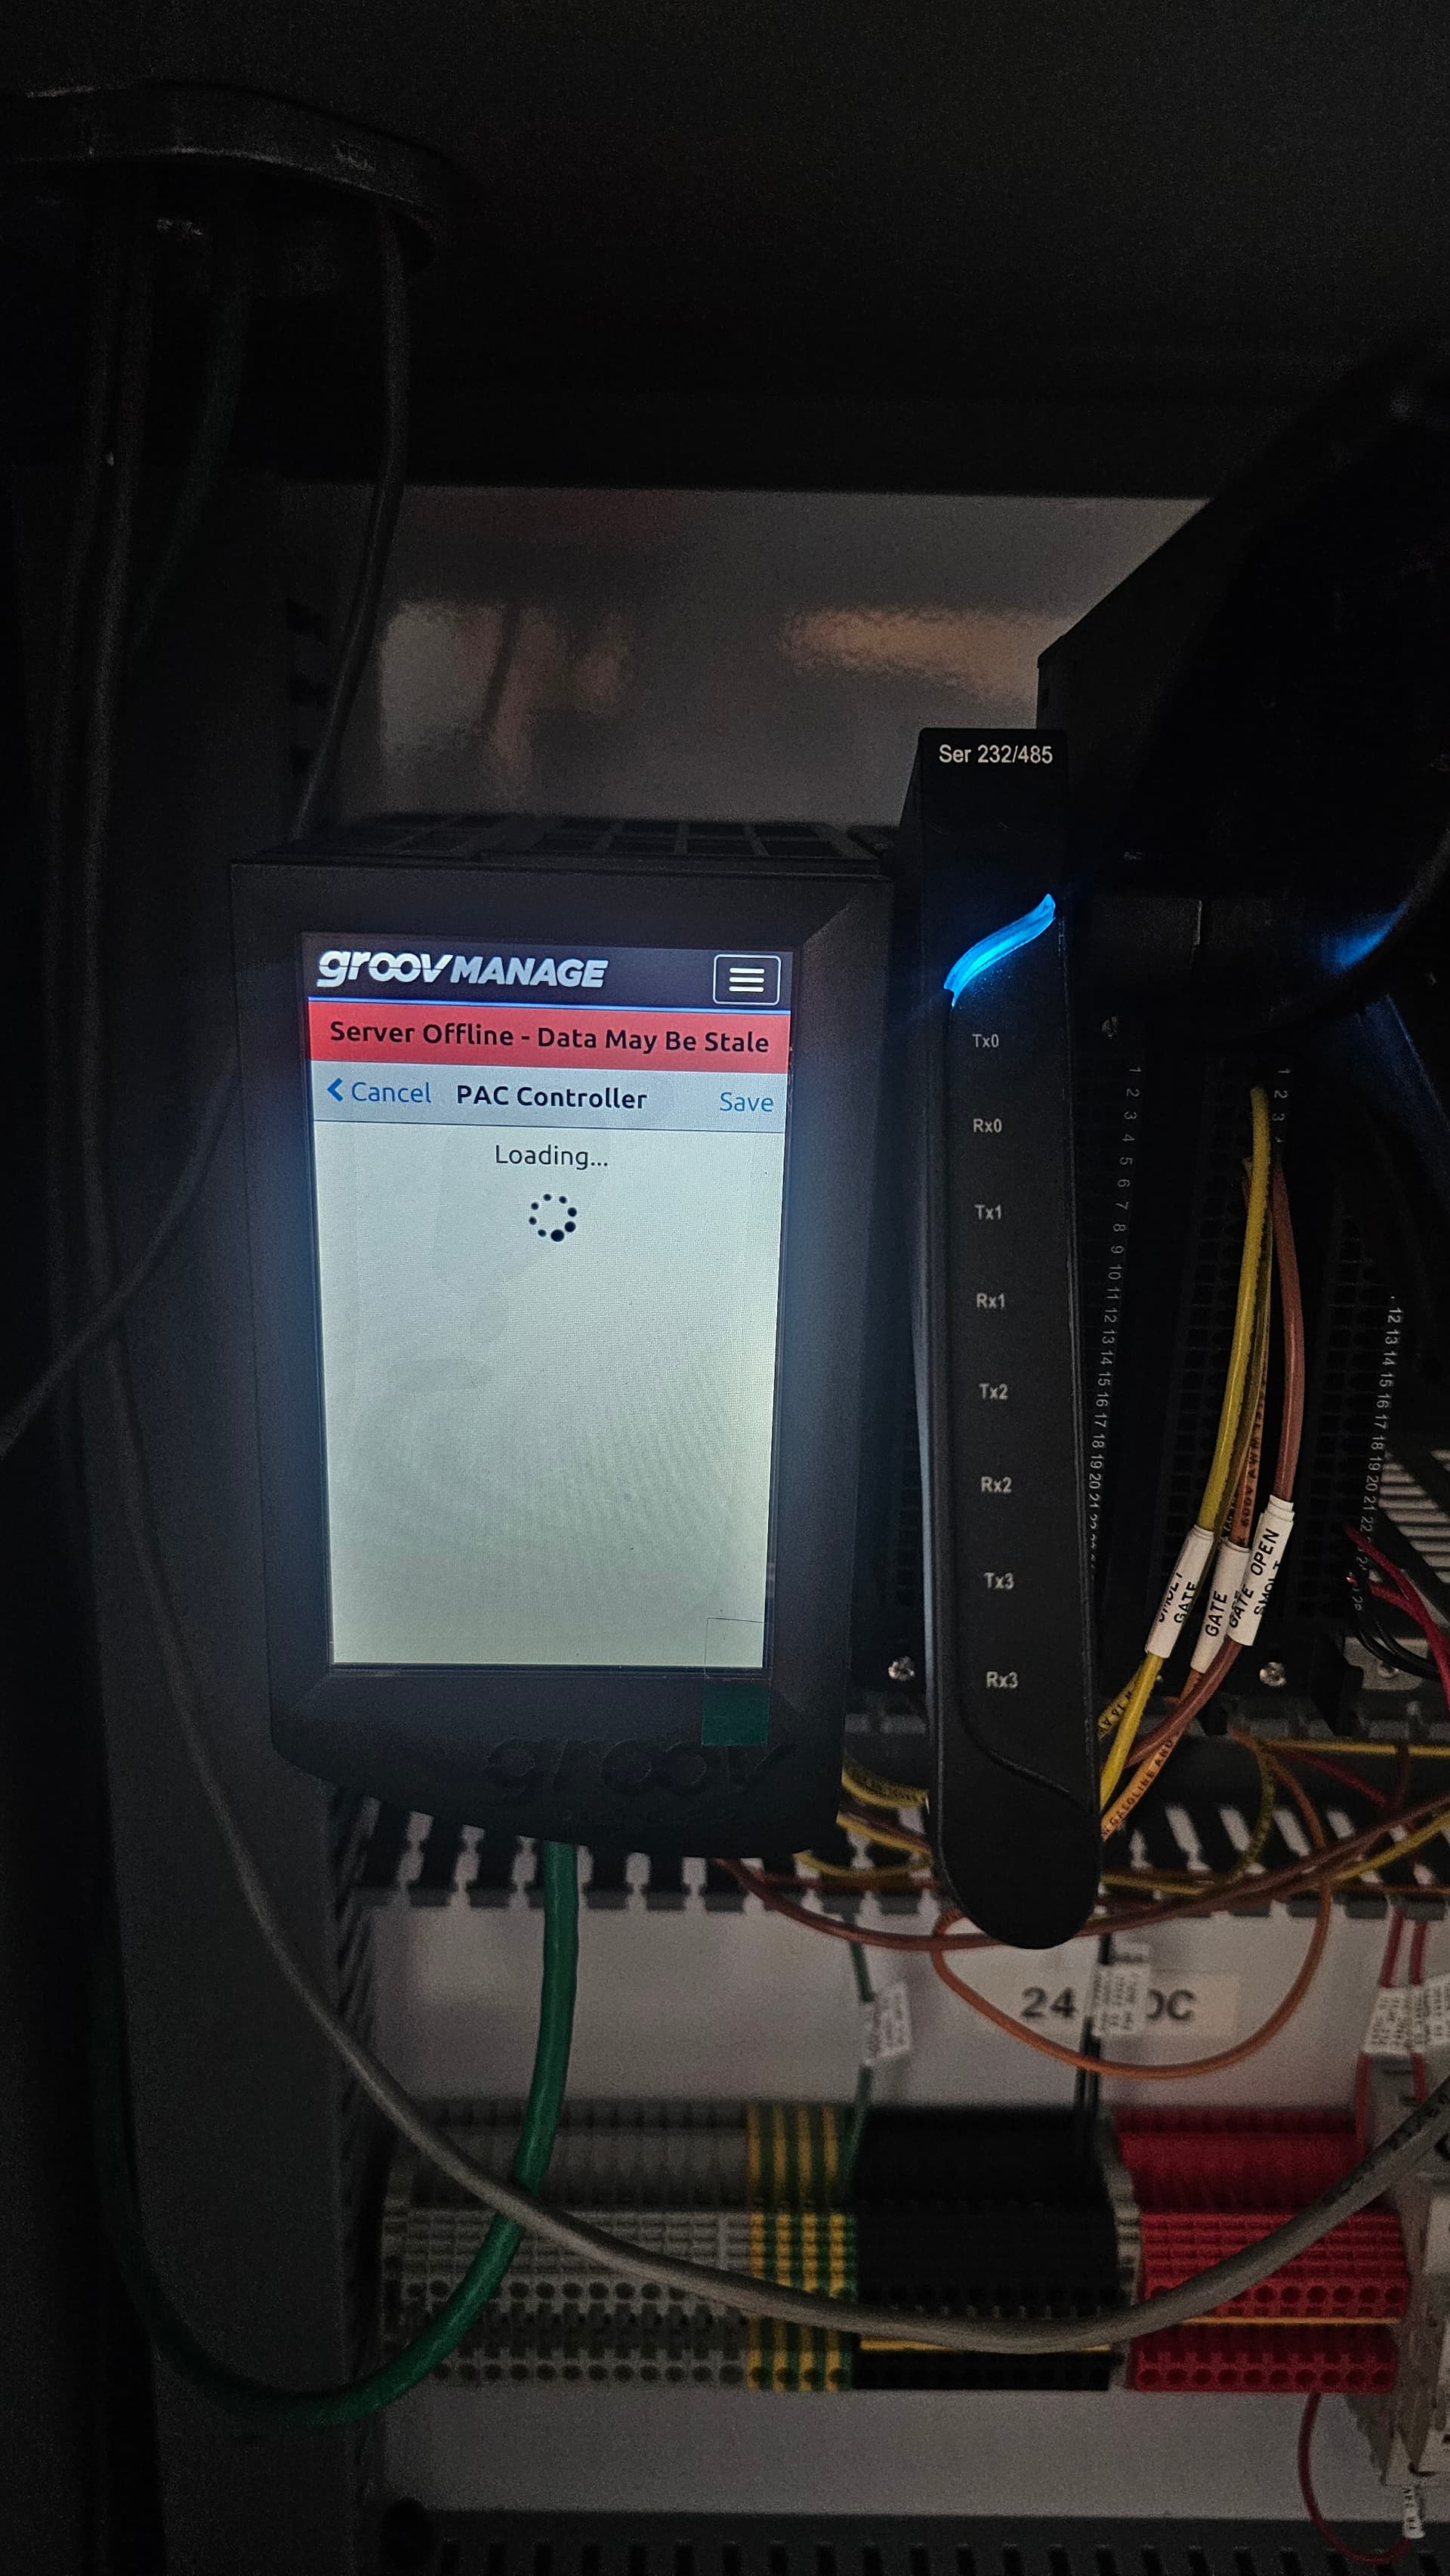
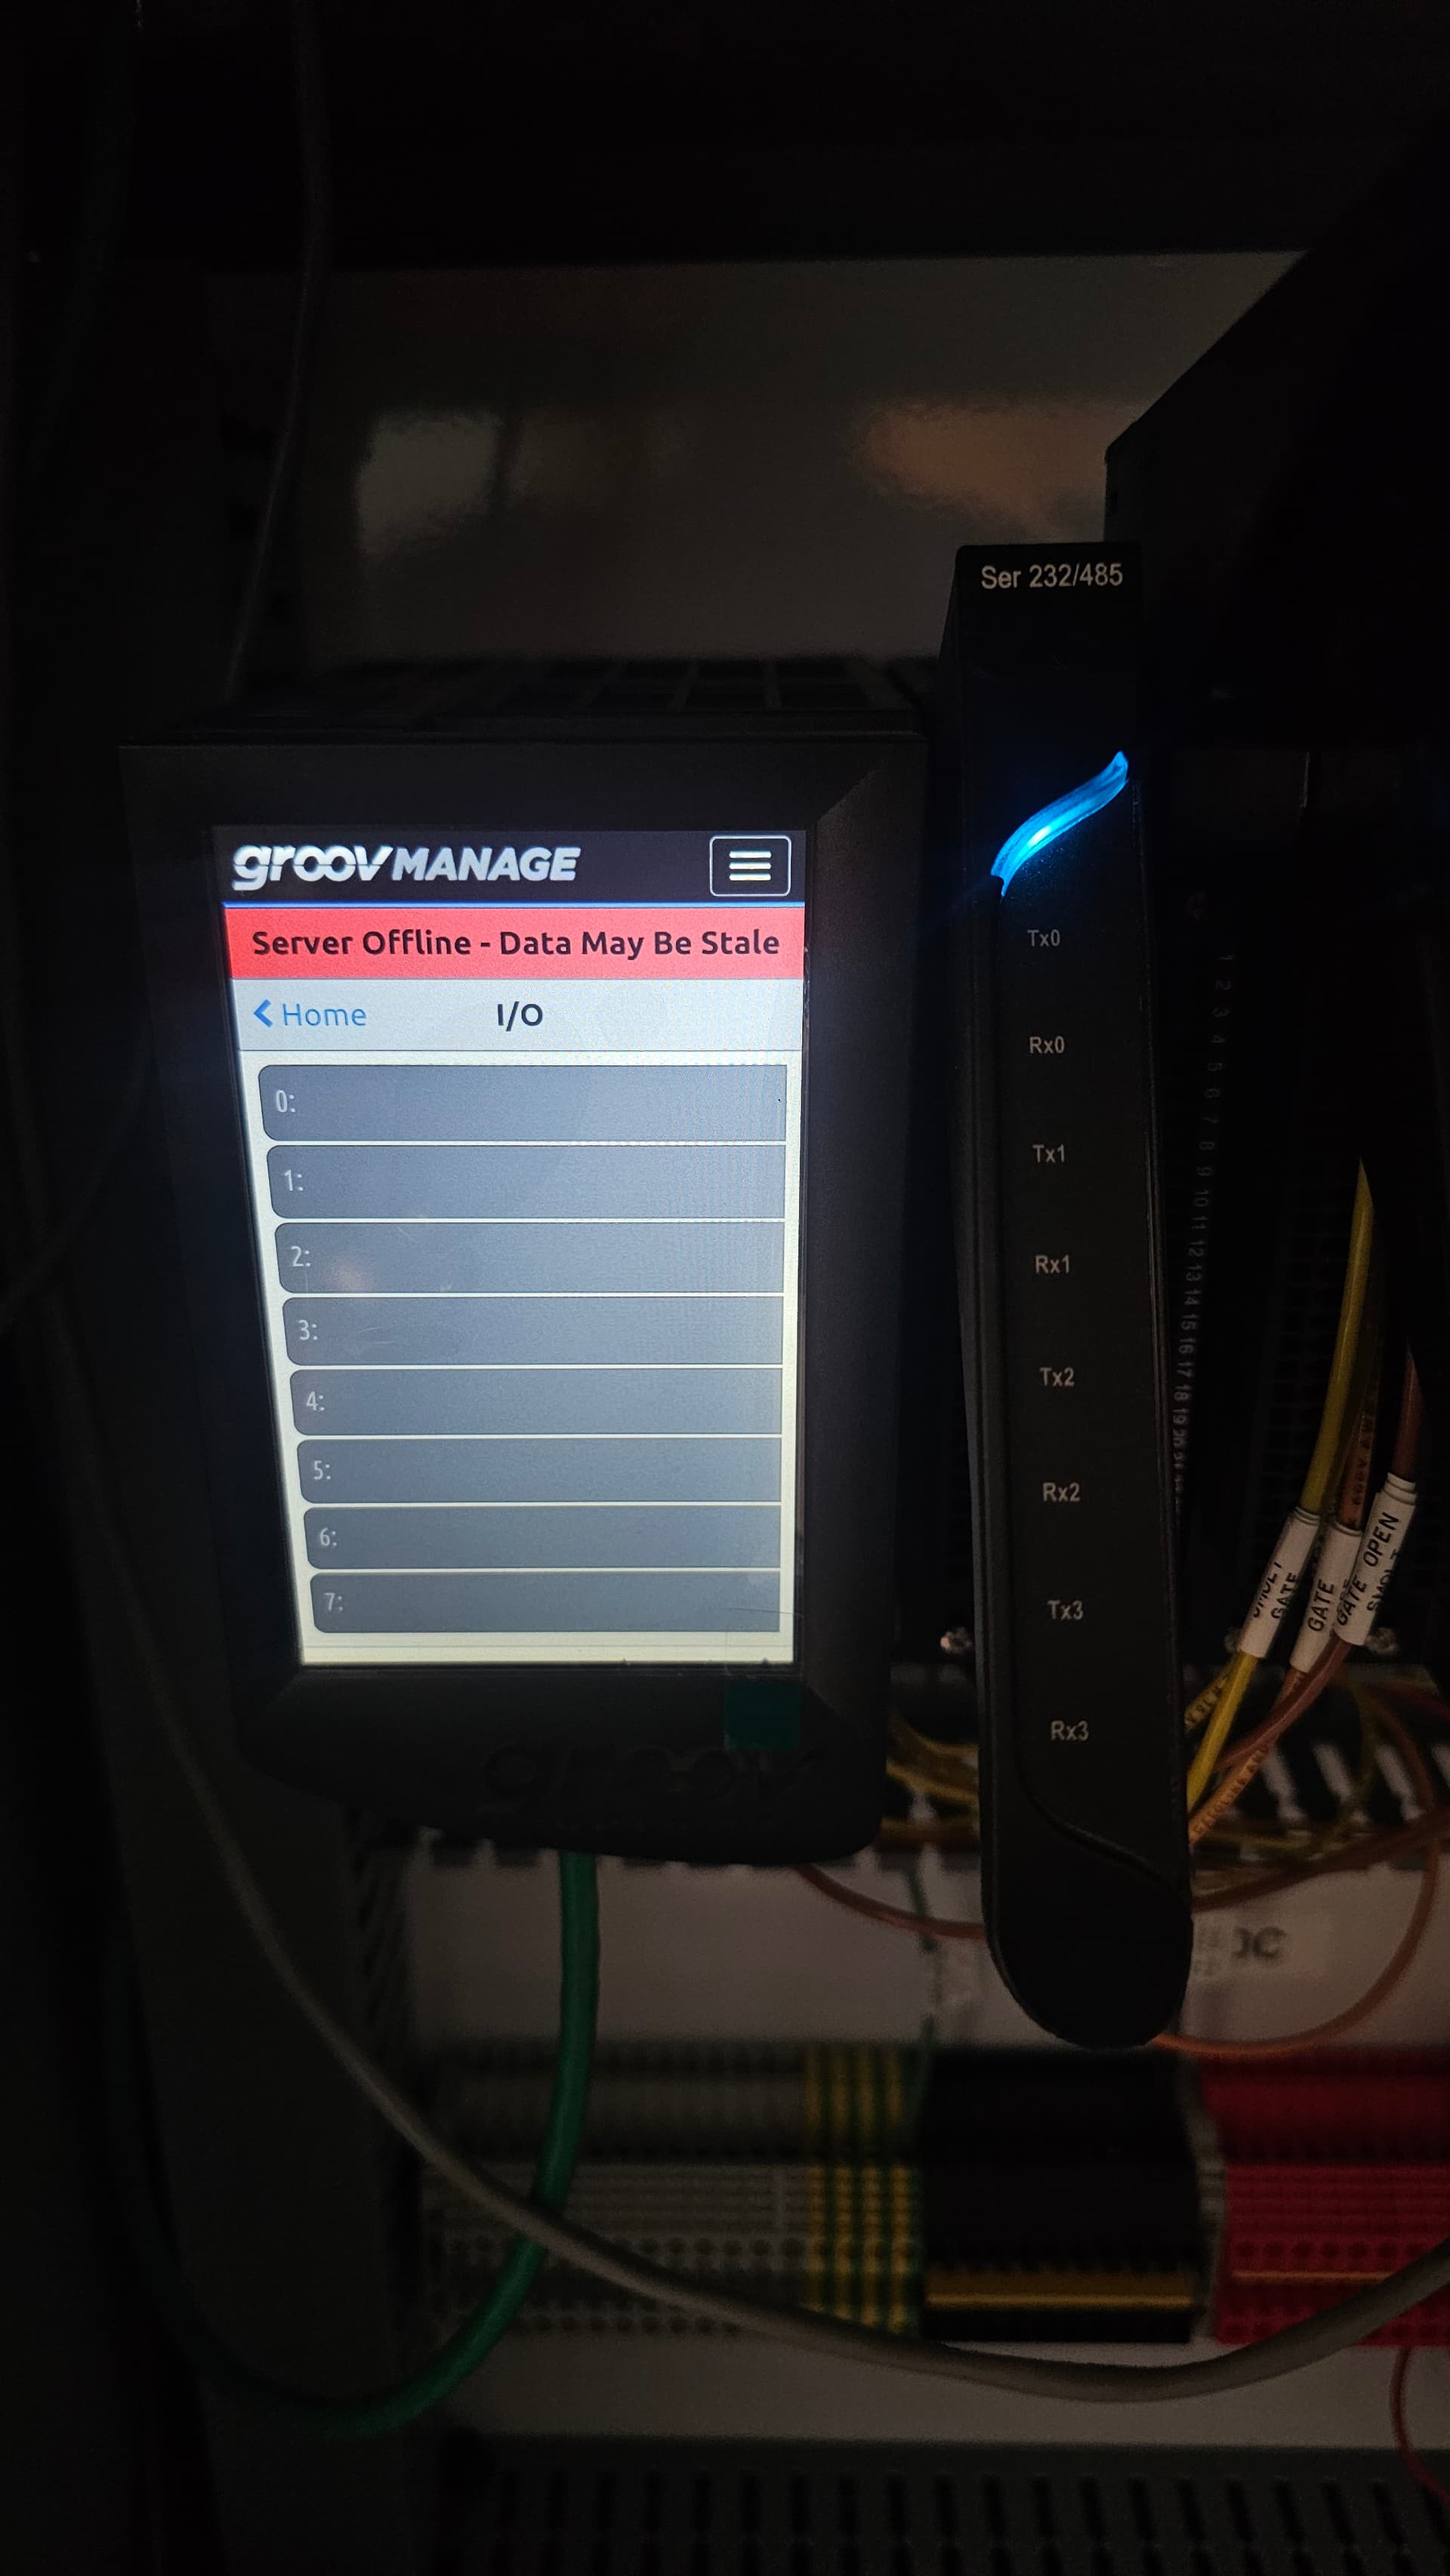
Has anyone encounted ever encounted this issue on GROOV manage? It seems like the groov’s web browser may have crashed on the epic, but I’m not sure why? Groov manage I not showing any of the connected modules, it is not showing any of network configuration and it is not logging the user out. I would really like to know what could have caused this as it is concerning about the reliability of these controllers for any other critical process control.
Anything I should do before rebooting the system to identify the root cause?
Has anyone encounted ever encounted this issue on GROOV manage?
I have, but there are numerous possible causes.
It seems like the groov’s web browser may have crashed on the epic, but I’m not sure why?
Technically the web browser is running on the EPIC in your screen shot. From the information you have posted, I can’t determine whether only the groov Manage server process is down (https server running), the https server is down, or something else.
Anything I should do before rebooting the system to identify the root cause?
If you have shell access, I’d see if you can run diagnostics to see what’s running and what’s not. You’ll also want to grab the logs.
Usually in cases such as this the best path toward resolving your issue is to contact Opto 22 support via form, phone, or email. They will be able to take a close look at your particular issue.
You may want to try and log into groov manage from a PC on the network to see if it works like that. Then you can see what the IO looks like and also download the logs for the support team. If all modules were red then make sure you are running the latest firmware.