I have seven interactive trends on one page that I noticed were not working. Six of them, the tag name changed to something else (this is a project I’m actively working on so it may have been after a strategy download or tag update in groov). I had to go into each trend and put the datasource back to the original tag which removed all the trend data.
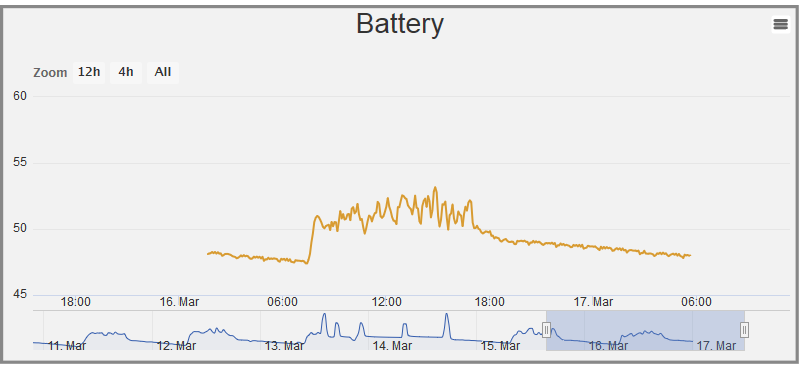
The last one has the correct tag, but it quit working around 5am this morning. The value gadget still works and shows the value of the point. It also doesn’t appear to be drawing the trend line properly.
Notice the trend line isn’t drawn all the way to the left. Dragging the timeline slider at the bottom doesn’t always work either, it will jump to another spot after moving it and not draw the trend line.
I have to move on, I will delete the tag from the data source and set it up again.
Also, I was hoping that the interactive trends would load properly when the page is first loaded with the latest update, but they still don’t?
I love how the saves take affect in groov view automatically now - that is nice!
Have you checked in your logs to see if any errors were reported? Also, did all of your trends stop updating, or just this one?
Notice the trend line isn’t drawn all the way to the left. Dragging the timeline slider at the bottom doesn’t always work either, it will jump to another spot after moving it and not draw the trend line.
The charting library we use applies some heuristics to determine where it should draw gaps, and they get confused on occasion. The missing data at the right side of the chart is probably confusing it. :-/
first value timeout called INFO - com.allen_sauer.gwt.log.client.Log
I see nothing in the Log at the time the trend stopped:
2018-03-16T13:27:41-07:00 Database vacuum finished.  INFO  - com.opto22.groov.server.database.VacuumDbHandler
2018-03-17T10:45:41-07:00 groov View version R3.5a (r46984), built Wednesday, March 14, 2018 10:44:56 AM PDT, is loading in a browser.  INFO  - com.allen_sauer.gwt.log.client.Log
Also, I tried searching the logs in the groov interface for 2018-03-16 and got tired of waiting - so I had to download them and look that way.
This really needs fixed, none of my interactive trends are usable in this state (other than downloading the data and processing it in something else).
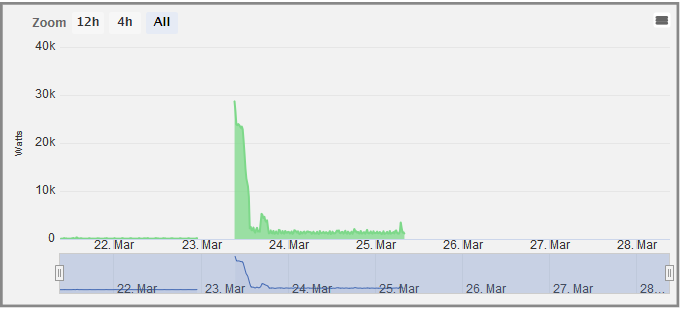
I downloaded the data from the above shown trend and there are only two “time gaps” for when the groov was powered down - you can see one of them from at the end of 3/22 into 3/23 and there was a small one of about 15 minutes on 3/23 at 12:30 which you understandably can’t see on the trend. All the other data is there up to the present time - you just can’t view it on the trend.
Here is another one:
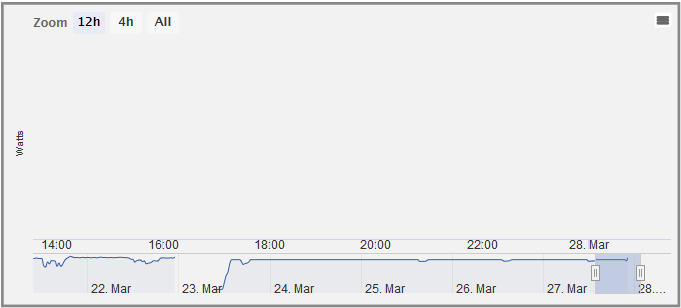
You see the data in the timeline, but it won’t draw it. If you drag the timeline around, sometimes it draws, and sometimes it doesn’t.
It connects to various time series databases such as Graphite and InfluxDB.
I use it on a couple Opto projects. I have a chart that pushes PAC Control data to InfluxDB and then use Grafana for visualization. It goes way beyond any historian I have ever used and is super fast. It would be nice to have it as part of a full HMI though. I would settle for an iFrame in groov to display it in, but it doesn’t look like we will get that because it won’t “zoom” properly or something (Yes, I do see the irony).
Hey, I’m just throwing out a suggestion. I don’t know why your trend isn’t rendering correctly at the moment, and again, we use a third party library for rendering (Highcharts) and I’ve seen it get hung up on weird things on occasion. Specifying the range ahead of time gives it one less thing to try and make a decision on, so there are fewer opportunities for it to choke.
I would settle for an iFrame in groov to display it in, but it doesn’t look like we will get that because it won’t “zoom” properly or something (Yes, I do see the irony).
It’s in the feature request queue and we’re considering it, but beyond scaling correctly, there are security issues we need to work through. Plus, the joy that comes with browsers enforcing mixed-content restrictions: an iframe served over http won’t work in a web page served over https.
The data in this case has a pretty wide range so the auto y-axis is necessary.
I also understand why you would use a 3rd party library - I just urge you, if this is their (Highcharts) bug, to put pressure on them to fix it. My customer is getting pressure from his customer, who in turn puts pressure on me, and I put pressure on you
My customer’s customer doesn’t care why it doesn’t work, they just want it to work and the best I can say is, I made Opto22 aware of the problem - you know what the next question is (when will it be fixed?) - Unfortunately, I don’t have an answer for that.
Now 5 out of 7 of my interactive trends on a page are not loading - They just say “Loading…” Same ones every time. Refreshing the browser isn’t working.
This is in the log:
Groov Log
2018-03-28, 21:05:07 GMT-07:00 INFO com.allen_sauer.gwt.log.client.Log - InteractiveBehaviorHandler(7) - No data available yet, trying again in 3 seconds.
2018-03-28, 21:05:07 GMT-07:00 INFO com.allen_sauer.gwt.log.client.Log - InteractiveBehaviorHandler(5) - No data available yet, trying again in 3 seconds.
2018-03-28, 21:05:07 GMT-07:00 INFO com.allen_sauer.gwt.log.client.Log - InteractiveBehaviorHandler(4) - No data available yet, trying again in 3 seconds.
2018-03-28, 21:05:06 GMT-07:00 INFO com.allen_sauer.gwt.log.client.Log - InteractiveBehaviorHandler(2) - No data available yet, trying again in 3 seconds.
2018-03-28, 21:05:06 GMT-07:00 INFO com.allen_sauer.gwt.log.client.Log - InteractiveBehaviorHandler(6) - No data available yet, trying again in 3 seconds.
2018-03-28, 21:05:04 GMT-07:00 INFO com.allen_sauer.gwt.log.client.Log - InteractiveBehaviorHandler(7) - No data available yet, trying again in 3 seconds.
2018-03-28, 21:05:04 GMT-07:00 INFO com.allen_sauer.gwt.log.client.Log - InteractiveBehaviorHandler(5) - No data available yet, trying again in 3 seconds.
2018-03-28, 21:05:04 GMT-07:00 INFO com.allen_sauer.gwt.log.client.Log - InteractiveBehaviorHandler(4) - No data available yet, trying again in 3 seconds.
2018-03-28, 21:05:03 GMT-07:00 INFO com.allen_sauer.gwt.log.client.Log - InteractiveBehaviorHandler(6) - No data available yet, trying again in 3 seconds.
2018-03-28, 21:05:03 GMT-07:00 INFO com.allen_sauer.gwt.log.client.Log - InteractiveBehaviorHandler(2) - No data available yet, trying again in 3 seconds.
2018-03-28, 21:05:01 GMT-07:00 INFO com.allen_sauer.gwt.log.client.Log - InteractiveBehaviorHandler(4) - No data available yet, trying again in 3 seconds.
2018-03-28, 21:05:01 GMT-07:00 INFO com.allen_sauer.gwt.log.client.Log - InteractiveBehaviorHandler(5) - No data available yet, trying again in 3 seconds.
I had to restart the groov because all my tags stopped updating - no errors, just nothing was changing. I could change a value, it would change the value in the strategy, but still would have the old value in the gadget - very strange. Anyways, the interactive trends are still not loading for me, even after the restart.
Thanks, I took a look at the log. Replying here so others may find it later if they need to.
For the trends, the pertinent logs look like this:
2018-03-29T07:42:11-07:00 nextAcceptableUpdateTimestamp - Found a last update timestamp that was seriously out of the expected range, ignoring it. WARN - com.opto22.groov.server.datalogging.ScannedTagState
The probable cause here is that the data files were corrupted somehow, most likely due to me screwing up something in the timestamp updates.
I don’t see anything that indicates a cause for all of the tags stopping yet. Give me a while more to bang on it.
There’s no easy way at the moment, unfortunately, but I’m trying to cobble together a beta for y’all right now to allow exactly that, along with downloading the raw data files so I can take a look at them and see what went wrong.
In the meantime, the only thing you can really do is temporarily assign that trend to different tags, wait a moment, and then set it back.