Groov View 4.3 is here!

So it’s been like, a year? Sorry about that.

groov View 4.3’s out today with a chunk of new features I’m hoping will help y’all out! As usual, you can download it from manage.groov.com.

New stuff, in no particular order:

Bit Picking

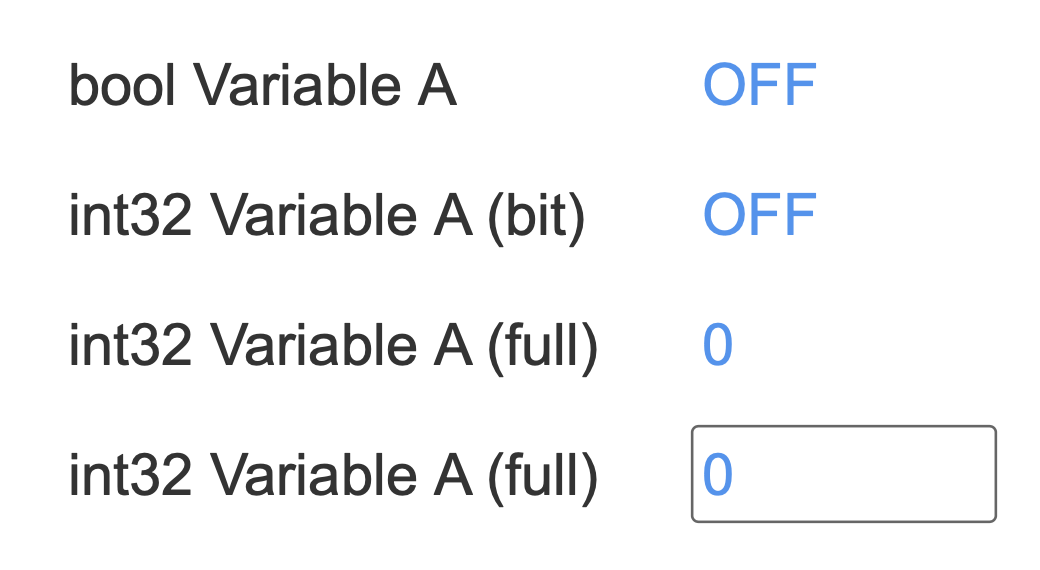
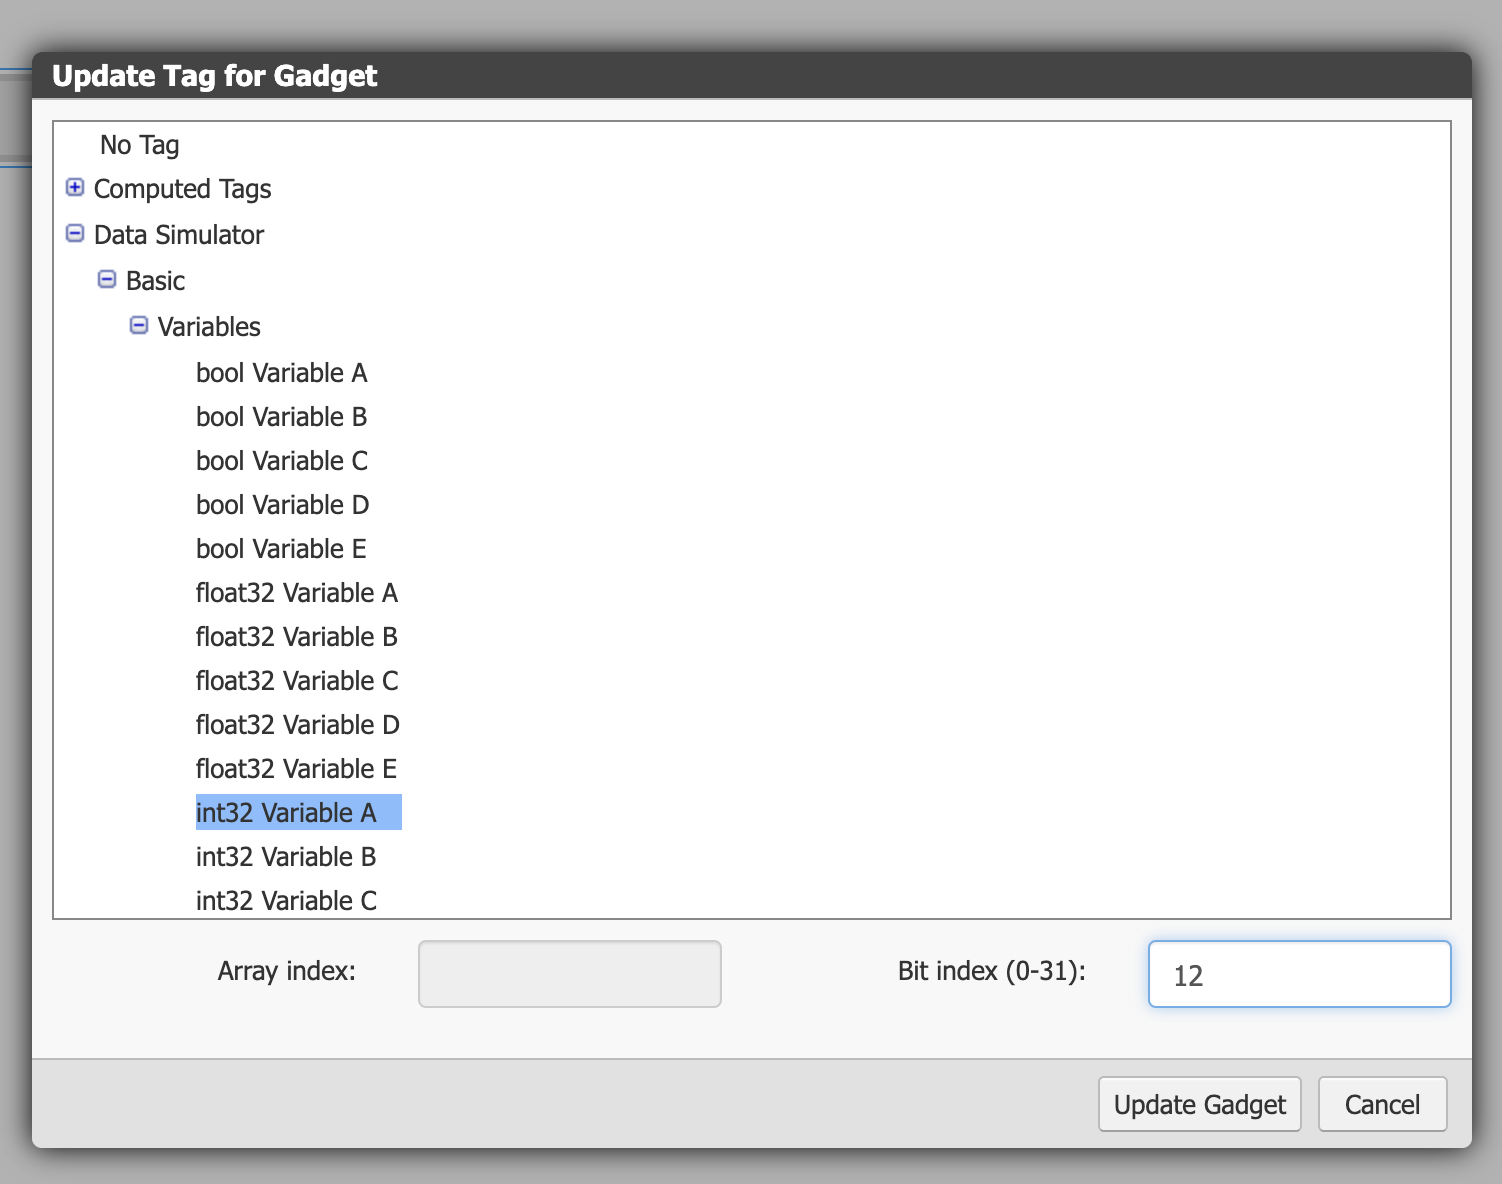
This one’s been in the planned feature list since the very first release. In groov View 4.3, you
can select individual bits out of any integer tag and use them as booleans. In the tag picker, just enter an index in the Bit field and you’re good to go:

You can also select an index from the Gadget Properties panel:

bit-picking-gadget-properties

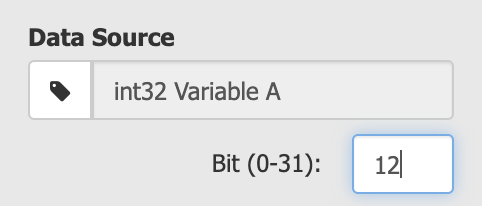
But there’s a bug in that one that I just found this morning. /cry You won’t be able to clear the bit index in that field, you’ll have to go into the tag picker to do it.

Improved Trend Downloads

A number of people have asked for the ability to download data for all pens in a trend at once, and besides that we’ve had some annoying issues with that download drop-down disappearing when the trend updates, so we’ve redesigned the download tool to allow you to download whichever pens you want, and it won’t disappear on you:

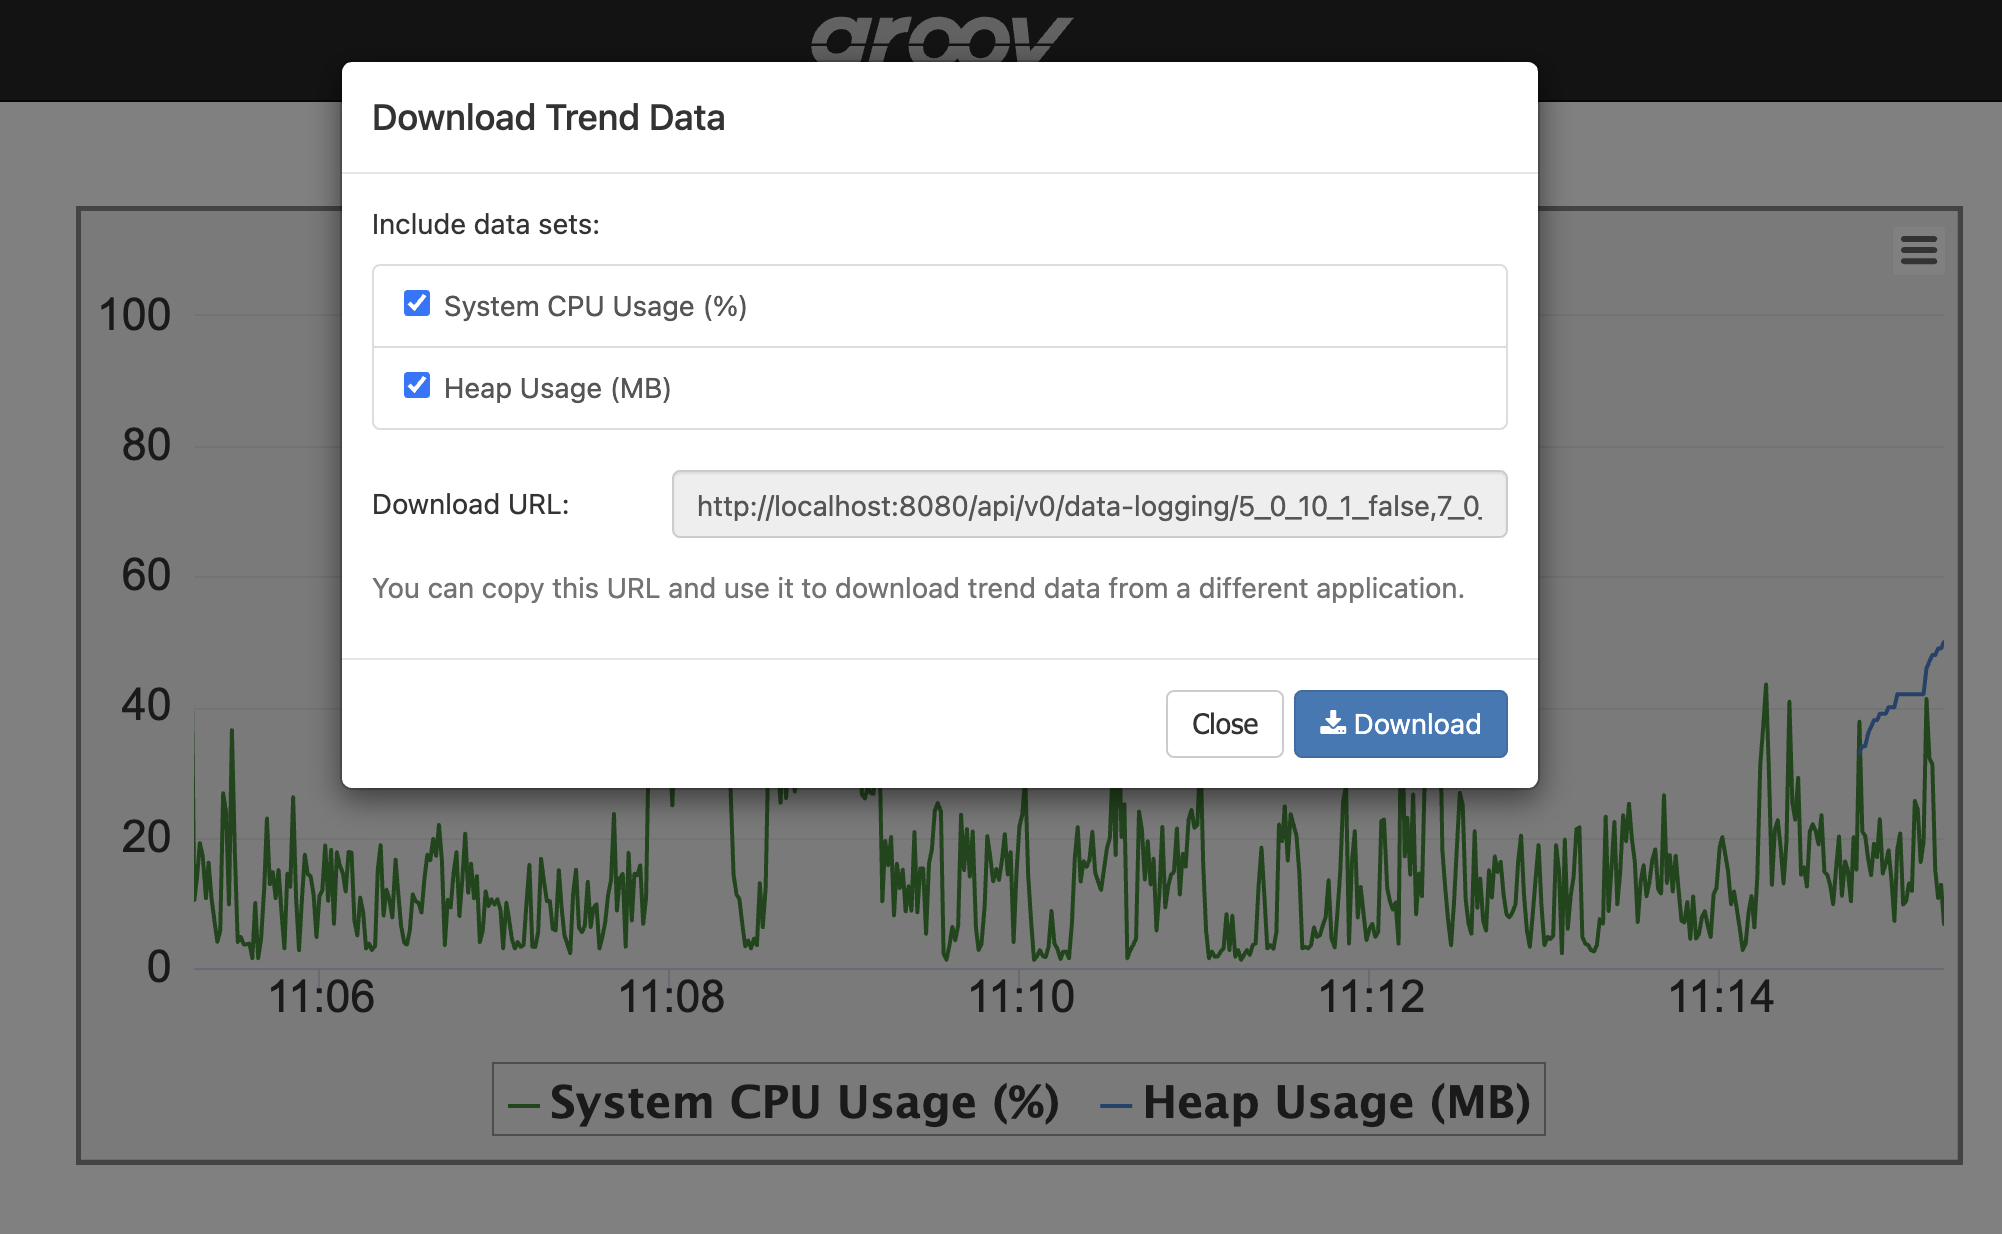
It’s been designed with expansion in mind: in a (hopefully near) future release I want to get timestamp formatting in there as well so you’re no longer stuck converting those Java timestamps. (Which are entirely my fault in the first place, sorry.)

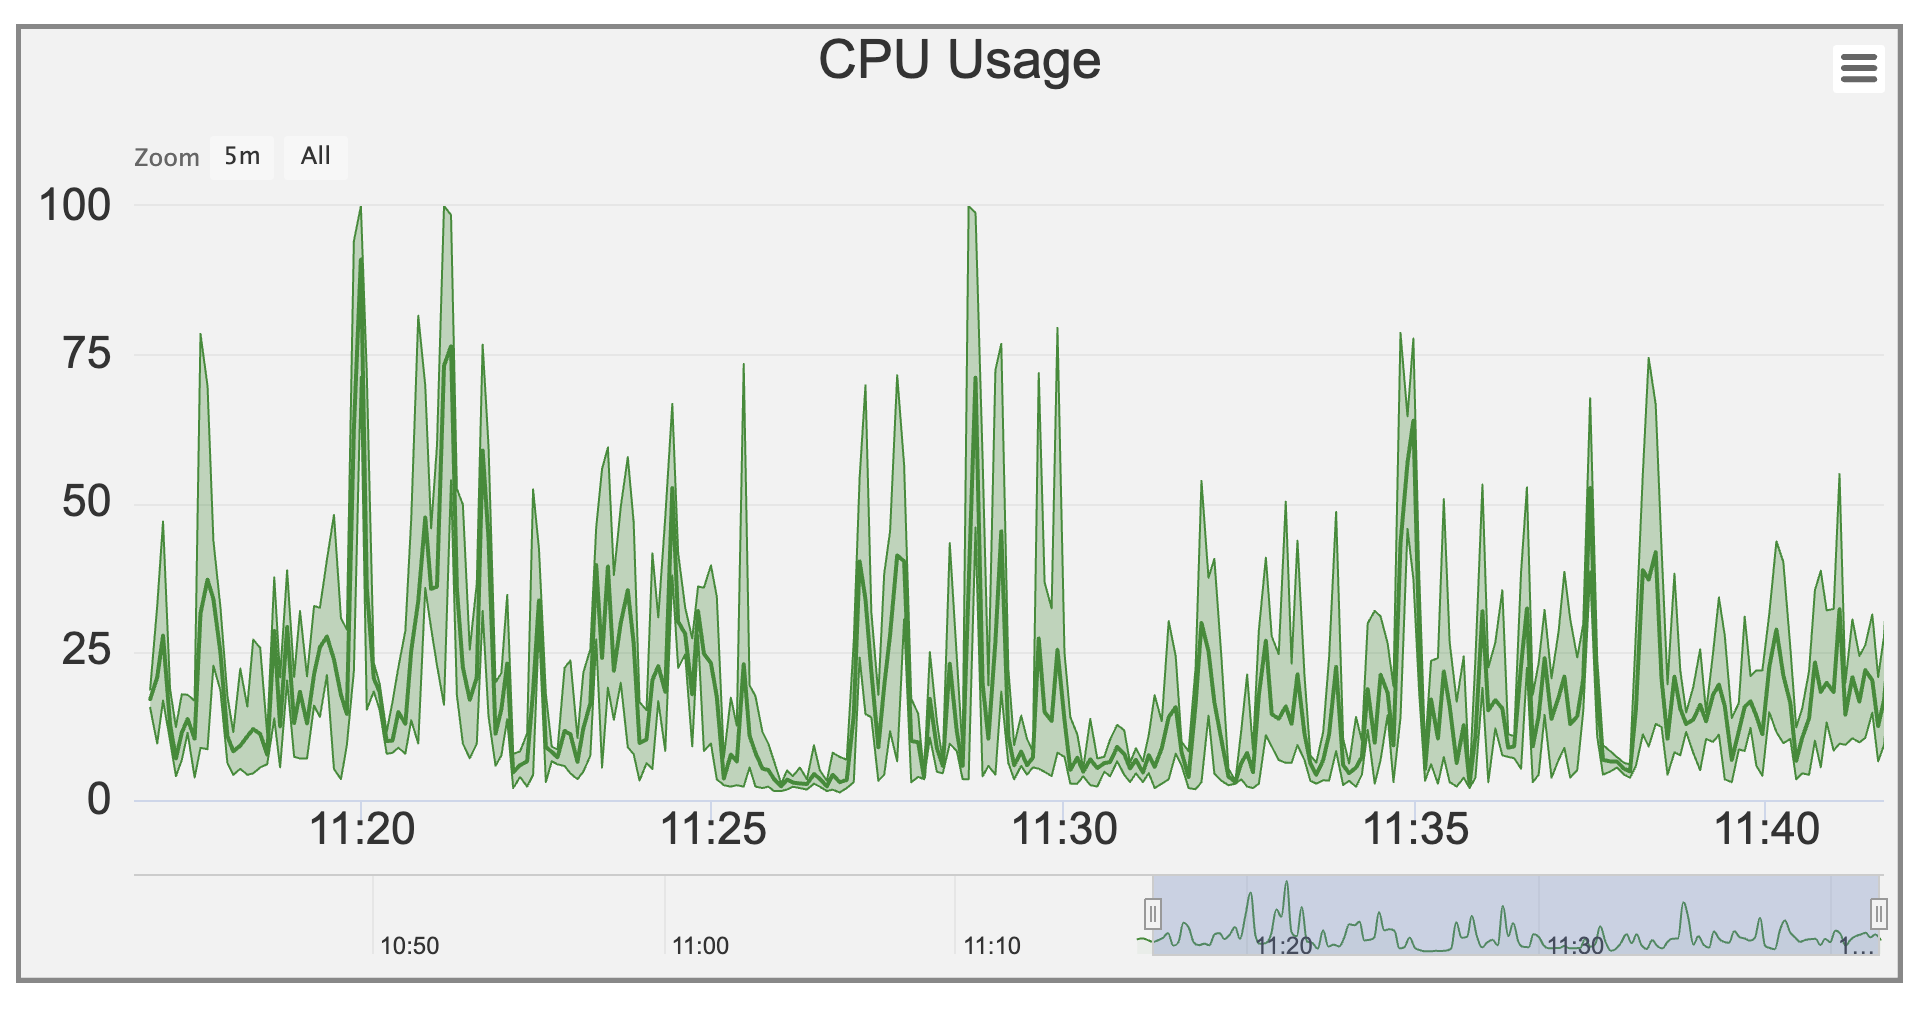
Display tweaks when you zoom out Interactive trends

In order to keep long-term trends responsive when you zoom out, we have to display a data set that’s been downsampled to get the number of points low enough to render interactively. We’ve been displaying an averaged line all this time, but we’ve been storing the minimum and maximum values for each data point as well, and in 4.3 we’re finally rendering those when you zoom out:

Computed Tags

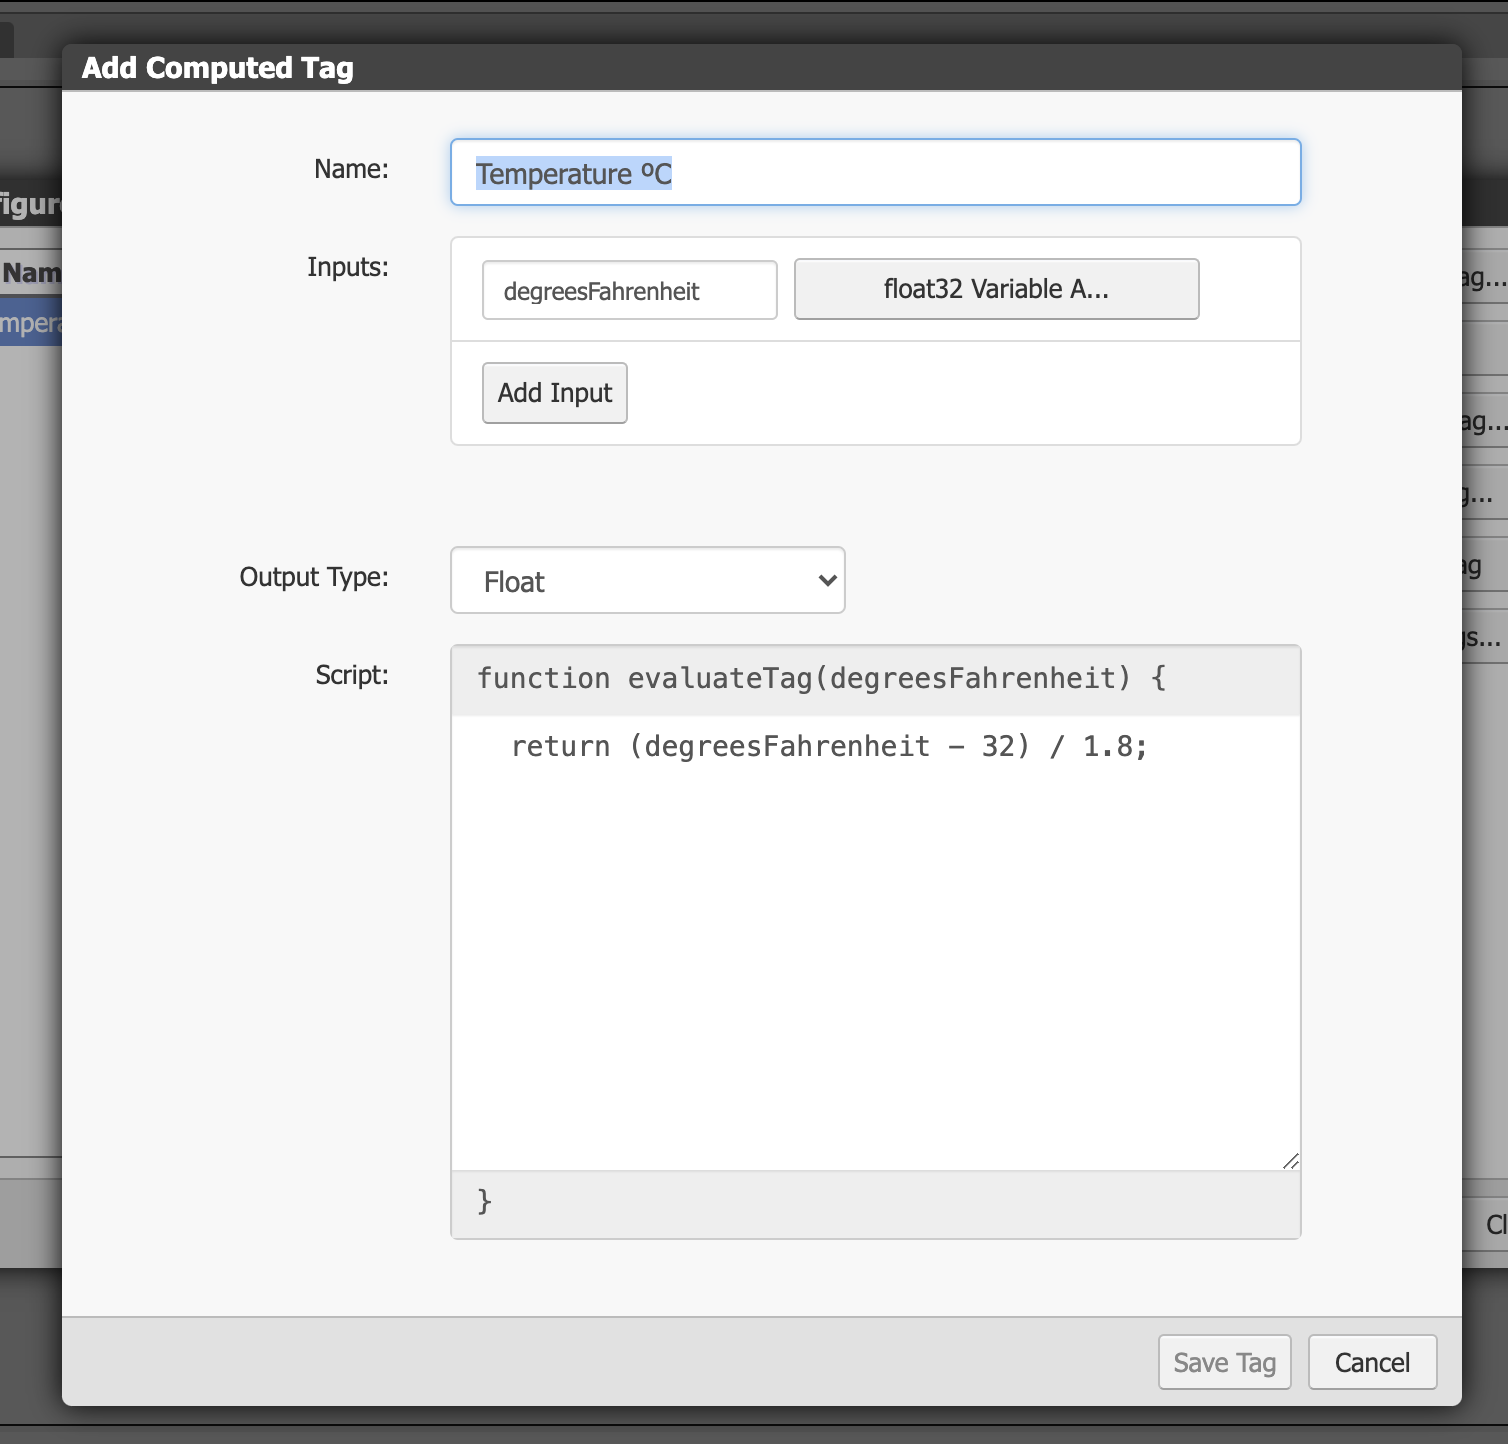
So this is a big one, and I’m super interested to see what you do with it. In 4.3, we’re introducing Computed Tags, which let you take any number of tags from your device, transform them in some way, and output a value as a new tag you can connect to a gadget/event/whatever.

Do you need to do some arbitrary scaling on a tag? No problem. Convert from Fahrenheit to Celsius. Easy peasy. Sum up the levels of a set of a water tanks and display them. You can do that too.

A Computed Tag takes a list of inputs from other devices, lets you run your own JavaScript function against them, and use the output in whatever way you want.

Miscellaneous other stuff

There’s a bunch of fixes and tweaks as well:

  • You can use integer tags for gadget visibilty now. 0 means it’s hidden, anything else is visible.
  • Recently viewed pages are cached in the client so they’ll display faster as you switch back and forth.
  • You can disable devices in Build mode, so if they’re offline while you do maintenance you won’t fill up your logs with errors.
  • Fixed the set of color choices on LED gadgets so you can get at all the colors regardless of what type of tag you chose.
  • Made sure that Text Box input gadgets focus the darn input field when you click on them in all browsers.

And some other stuff that’s probably too minor to mention here, but it’s in the readme.

3 Likes

Can’t wait to try this out.

Can I use a local datastore integer as an index to pull a single value from a strategy table? :pray:

Not yet, sorry. :frowning:

The computer tag evaluation doesn’t run until all input values have been gathered from the scanner.

So there is still hope!

Thanks for the useful update.

Still no ability to launch straight onto a page without logging into GROOV?

Not not yet. (The feature has not been forgotten - just not yet delivered).

Looks like some good changes. I am presently evaluating groov to replace an existing HMI. The current version for the trial download is 4.2b. Will this be changed to 4.3 soon? Since I don’t have an activated version of Groov, I cannot download the latest version at -manage.groov.com. Thank you

I deliberately have an unactivated groov Server for Windows in my manage.groov account to test stuff like this and it correctly shows the latest version.

That said, yes, the demo version is still the old version, so I will let the web guys know and get it fixed first thing this morning. Sorry for the delay.

EDIT. 3 hours later - the web team have updated the demo page to the correct version.

Any chance of being able to turn off the min/max trend points in the future?
I get that there are times people will want them, but sometimes the average is good too.

1 Like

So just a comment on the “bit picker” feature – I was looking forward to using this, however I found that for the Value Gadget it really does not do much good. That is because even though the input source uses the bit picker feature, it still treats it as an integer input. So then when it displays a value, it is just “0” or “1” – whereas when I put an actual boolean type in (such as digital input or output) I can choose what the output will be, such as “on” or “off”. A digital 1 or 0 doesn’t help much when I am trying to display a status.

So then I have to go back to my original way of doing this and just use multiple text gadgets on top of each other with the visibility feature.

Maybe I am missing something. Thanks for your help.

I’ll take a look at that, probably just missed it. I mostly test boolean stuff with checkboxes and LEDs, sorry.

Ok, looks like it’s an issue with the editor, not the output display. The editor doesn’t update to let you choose the output string when you switch to a bit, but the gadget itself will render OFF or ON in View mode:

I’ll get that fixed in the next release.

Edit: Looks like you can work around it by changing your Value gadget’s tag to a normal Boolean one (there are a handful available in the Data Simulator if you don’t have another device handy), updating its On/Off text, and then changing it back to the tag you want to use. If you need to do it for multiple gadgets, you can create one template gadget assigned to a normal boolean tag, fix its On/Off text, and then duplicate it and change the tags to what you want.

I tried what you said and verified the behavior. Works great. Thank you!

The new version of Firefox also has this. I have 10 video controls on one page. Is there any problem with using proxy for all video controls?

I normally use Chrome, but tested my site in Firefox just now.

There are more cameras below the fold. 10 in total.
All work as expected.
There is no problem using groov proxy for all video controls.
All are set to use groov Proxy because some cameras are https and some are http.

If you are viewing the same camera URL on all 10 video gadgets, there is a very good chance that the camera can not support that many connections and is dropping some.
Try using different cameras (search the Internet for some open cameras if you don’t have more cameras on site to test) for a test.

There was a change to the proxy service in 4.3 to fix an issue with extra @ symbols in URLs. Can you take a look in your logs to see if there are any errors or warnings displayed when you try and view those cameras?

I haven’t tried 4.3 yet but if the trends now show the min/max points all the time, it will require explaining to every user. I hope we can choose to hide this soon (if we can’t already).

Regarding the min/max points on interactive trends: one issue that’s frequently come up with product support since introducing long term, interactive trends in groov View 3.3 is that when you zoom out a bit on a trend, peaks disappear or get smoothed down.

Those trends store a lot of data: 31 days at one update a second means 2,678,400 points per tag. We can’t render all of that interactively, and it’d be meaningless to try anyway: your monitor doesn’t have the resolution to do it. Beyond that, the groov AT1, AR1, and GRV-EPIC-PR1 aren’t fast enough to allow us to interactively query that much data.

So in order to support those long term trends, we compromised: we store the full data set at the period and update interval requested, but we also store down-sampled, averaged copies of the data as well. As you choose the time interval you want to display on the trend, we pick an appropriate data set and display that one. It becomes more accurate the more zoomed in you are, and less accurate as you zoom out. A number of customers had issues with that: they want to stay zoomed out without losing the peaks.

We planned for that, and we’ve been storing the minimum and maximum values for a given time interval along with the average value. The trend update in 4.3 now shows you both: you get the same average you’ve always been seeing as a solid line, and a shaded region behind it shows you the minimum and maximum range for that time period. As you zoom in, that shaded region will more closely hug the line, and if you zoom in all the way to the raw data set, the shaded region will disappear, showing only the line, because it isn’t an average anymore.

Note: none of this applies to Classic trends. Those ones always show the raw data, no downsampling.