I am just beginning to think about upgrading a PC-based control system to an EPIC controller. One of the features of the existing PC app is the editing of recipes in a database. I think the Node-RED dashboard could be used to do this more efficiently than groov View but I was wondering if the dashboard pages could be secured using the same user logins as the groov View pages. Is that possible?
One of the main things about Node-RED running on EPIC and RIO is that we put it behind the firewall and groov Manage authentication.
So this means Node-RED always uses the SSL encryption (certificate) AND it uses the same groov Manage user management.
Oddly enough we have had several requests to turn off the user/pass requirements for the Node-RED dashboard… It seems we have several OEMs that want their customers to gain quick/unfetted access to the Node-RED dashboard but not to the Node-RED flows or to groov Manage itself… The software guys are looking at that request.
But in your case @Joey1 yes, your Node-RED dashboard pages are secured using the same user logins as the groov View pages right from the get-go.
Cool! Is that done through Manage? Can user access be limited to specific flows or is it set up that specified users can access any Node-RED pages? Sorry for all the questions, I’ve only just thought about doing this recently and I’ve not yet used Node-RED for UI functions.
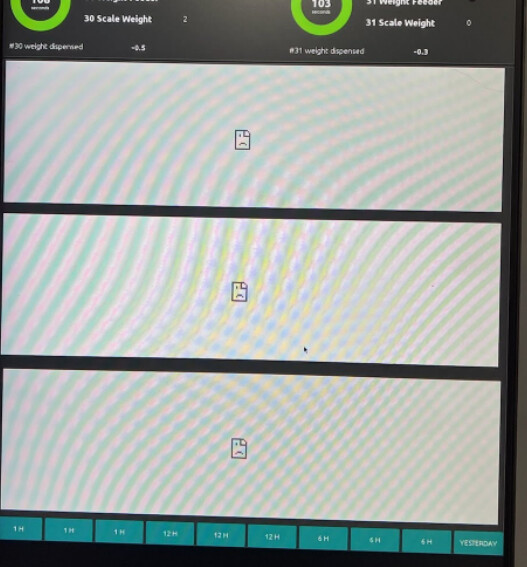
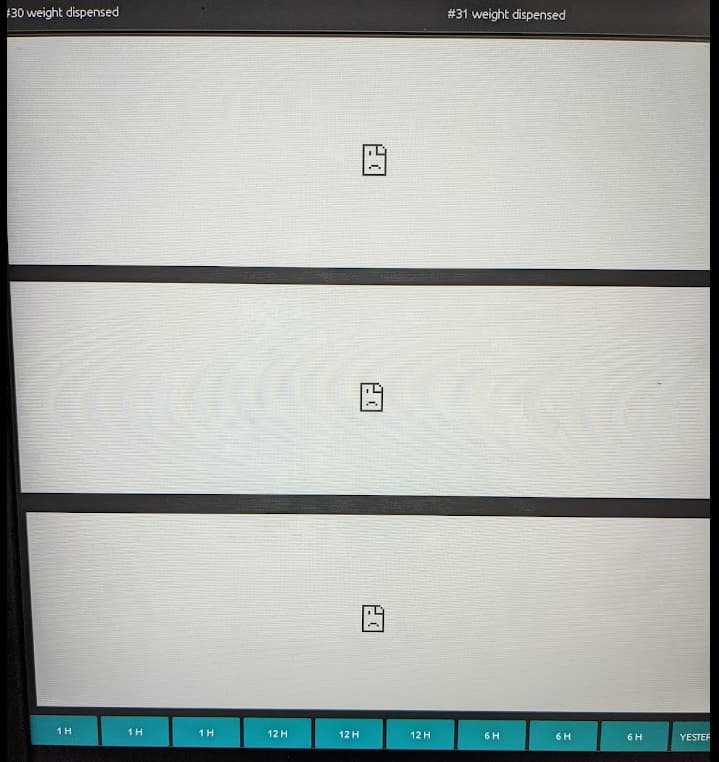
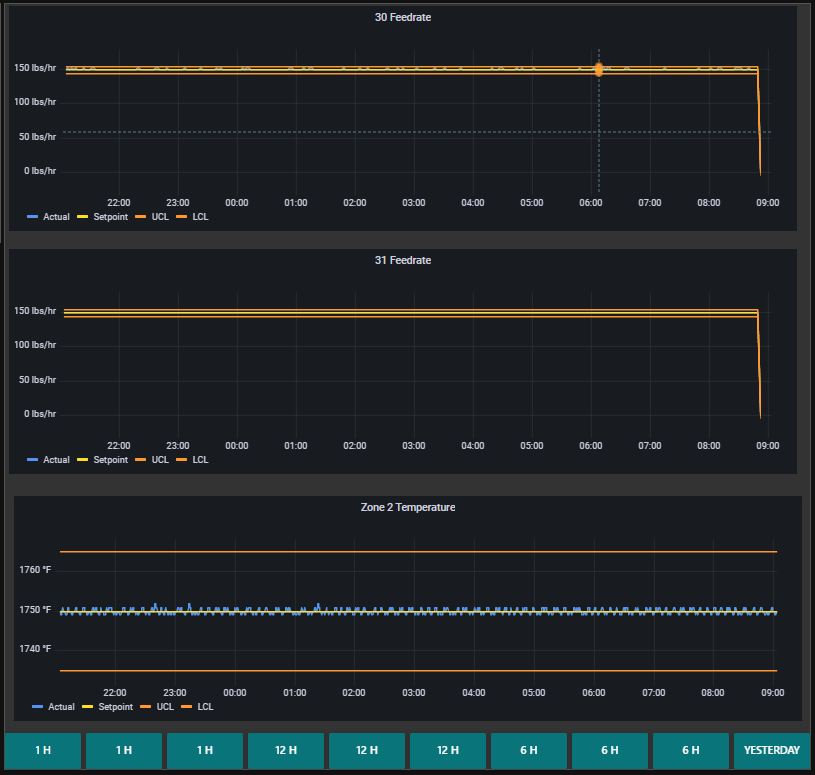
We are using the Node-RED dashboard on an EPIC. When viewing NR dashboard from my PC, I can see the graphs (embedded iFrames), but at the actual EPIC monitor, I see this:
Check your network settings in groov Manage on the EPIC.
The fact that your PC has a route to the graphs URL (ie what ever IP/host/gateway they are on) but not the EPIC points to a network settings issue.
Remember, its an iFrame, so you need to be able to access the URL. iFrames are just place holders, not actual images just pointers to the image… to that end… Another way around that issue is to not embed them as iFrames, but to use a file node and save them to the EPIC file system and serve them up as ‘static’ images. Depending on your refresh rate, it could be a lot of file writes to the EPIC SSD.
EDIT. Just another thought… are the iFrames http? If so, the Chrome browser that Node-RED is using may not like mixed security on the same page. Its https and the iframes are http, so they are mixed content and hence the unhappy face.
The iFrame graphs are https and there is no password required to access them. It’s a local IP address.
I do not see anything in the Network settings page of Manage that would allow access here. Is there any way to fire up a plain old Chrome browser and try out the URL?
This is being used on a piece of equipment that is being used for production, so I only have limited windows when I can futz with the settings (and that window just closed, so no-can-do on the groov View). I have another similar setup with a Rio which should be available. I will see if the same https iFrames are visible there.
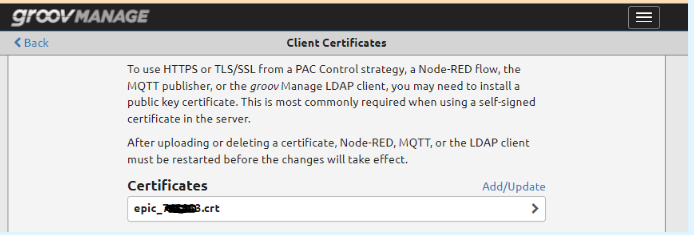
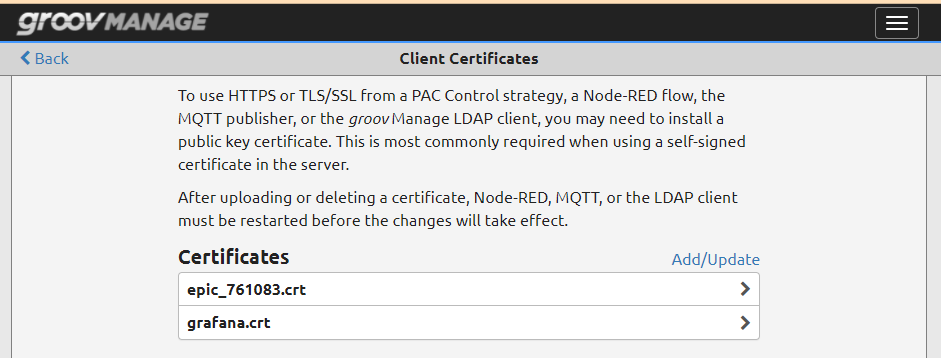
Yes, I would like to add my self-signed certificate (corresponding to the https server where the graphs are) and see if that helps. Would it be added here?
Yes, the graphs PC cert goes in the groov Manage client certificate area as per your screen shot.
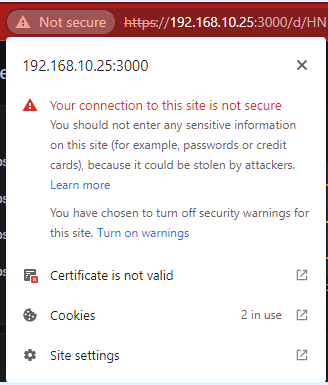
The graphs PC cert should be using its IP address that your Node-RED dash is using for its iframe URL and because its a local IP for the cert and PC, it will be ‘not secure’ as you show.
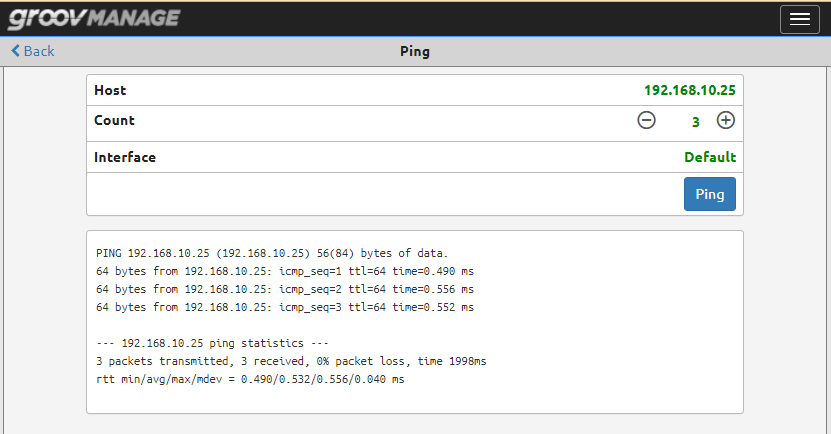
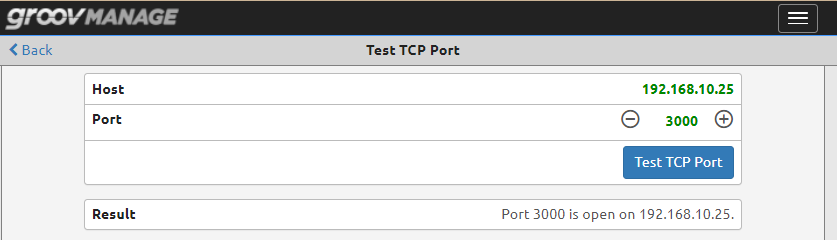
Another sanity check you can do on the production EPIC that wont interfere with anything is to ping the IP address using the groov Manage network tools and also do a ‘Test TCP Port’ check for an open port on the PC you are getting the graphs from to just make sure the EPIC can ‘see’ the graphs PC across the network.
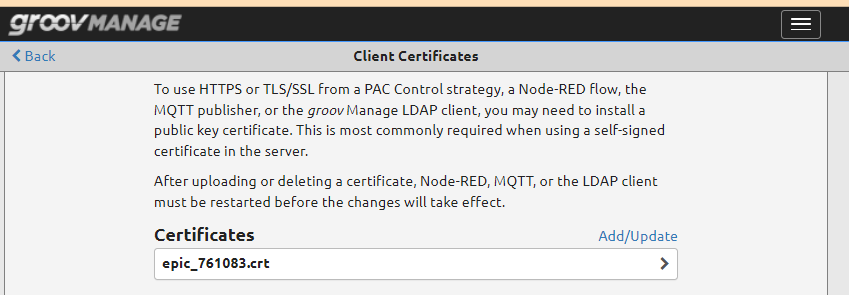
I struggle a bit when it comes to all this certificate stuff. Do I just click “Add/Update” here and add my self-signed certificate (then restart to take effect)? Should this cert end in .crt?
Since this is a self-signed, self-created certificate (which Chrome recognizes as unsecure), would it make any difference if we got one from a trusted 3rd party?
Here is the same portion of the screen when viewed from any other PC on our network:
I doubt there will be, but is there anything in the Node-RED logs in groov Manage when you open that page from the HDMI vs PC?
EDIT: No putting a trusted cert in won’t make any difference since none of these devices are on a domain that can be verified. There clearly is a cert in the PC’s that is not in the EPIC. Just need to use developer tools on the PC to find the right cert and put it on the EPIC.
Did you restart the EPIC? I believe this is the built-in chrome inside the EPIC that needs to validate the certificate. Hopefully the certificate store that you have access to in the EPIC is also the one used by the internal chrome browser, I do not know how chrome manages certificates.
You could certainly setup a cert from a real CA, but you would need to have a real valid domain to use.
I also wonder if you were able to setup some sort of proxy using Node-Red (or nginx if you have SSH access) to access the graphing server - that way you could have clients that can access the dashboard, but won’t need direct access to the graphing server.
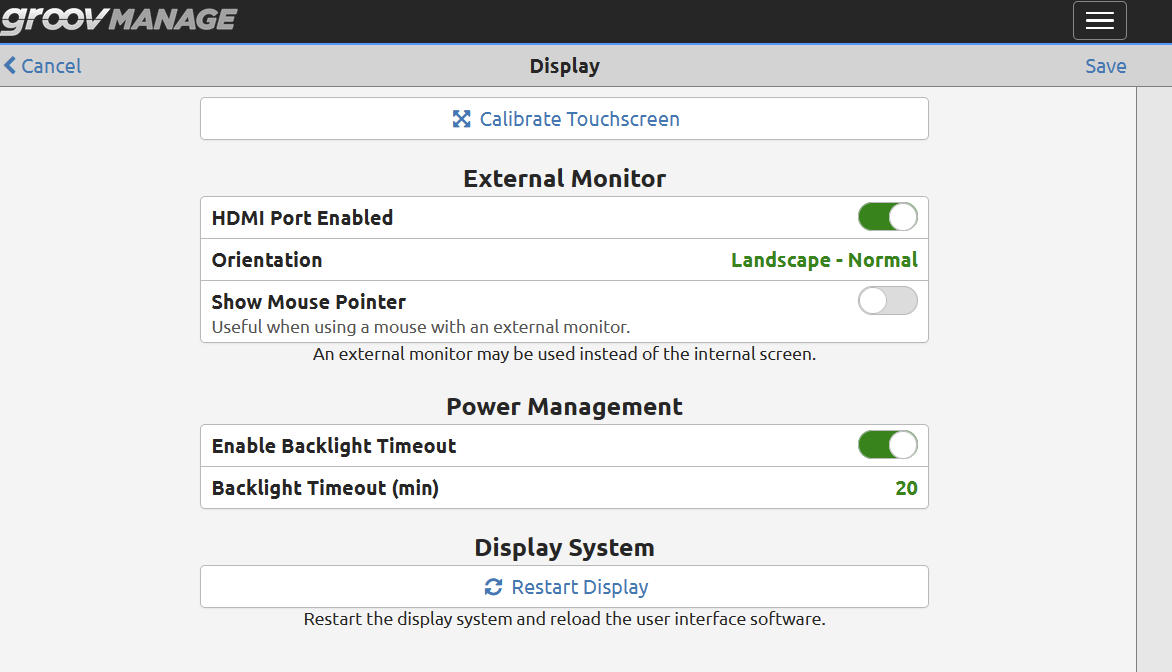
Edit: You may be able to restart the local chrome here by using the Restart Display:
Unfortunately, rebooting the EPIC did not make a difference. Still not able to see the iFrames on the monitor connected to the EPIC, but all other browsers looking at the same NR dashboard can see the iFrames fine.
FWIW, on the other browsers, I had to first “accept” the safety risk thrown up by Chrome before the iFrames were displayed. I suspect that since NR Dash is not giving me that ability to accept, it will keep blocking the iFrame.