Does CPU Usage correlates with Firmware version

Hello,

I have two EPICs, EPIC 1 running firmware 1.5.0-b.42 and EPIC 2 running firmware 3.3.3-b.192. Both running the same software, except EPIC 2 have couple extra small features for safety. The thing I have started noticing after the last firmware update EPIC 2 have CPU Usage at 70% ± 5% when running but EPIC 1 when running have CPU usage of 35% ± 5%. Does the new version of firmware take up more resources from the controller?

Not that I have noticed.

Are you running Node-RED?
If so, can you try this flow on each and see what process is using the CPU.

Finally

I got to do your recommendation and check EPIC 2. showed me some weird bizarre numbers.
What do you make of this?
CPU at 200% ??

Any chance of doing the same on the other EPIC?

SoftPAC can make use of all 4 cores, so you might see up to 400% CPU.
But, just the fact that you have 200% is a big red flag to me, it usually means you don’t have enough well placed delays in your chart(s). This will cause the CPU to work extra hard for no benefit.

I strongly recommend you review the PAC Control section of the best practices guide:

2 Likes

Thank you,

Regarding the other EPIC, I cant really test it since it is part of a qualified process and changing anything will force me to re-qualify it.

However, i have increased the delays I have there already and the CPU dropped to around 150%.

how much lower the CPU utilization should be to be considered “safe” levels ?

A 50% reduction is a good start, shows the power of delays.

Before I throw a number out there, whats your PAC Terminal Loop Time?

I see it around 7.5 ± 1.0 msec

I’d be super interested in know what the other EPIC comm loop time is as well - you should be able to do that since there is zero changes in looking at it for a moment in PAC Terminal.

So, now that we see the comm loop time is not crazy, I wonder all the more why the CPU is up around 150% There is some heavy stuff going on in that strategy.

So, it turned out to be one chart that is causing the CPU usage to be up that high.

I keep this chart running to allow the operator to load, calculate, and clear data when needed. when i disable this chart the CPU usage drops to 80% or so. other 4 running charts had no effect on the CPU when disabled.

I don’t know why though, it only checks for input and only run the script when input = 1.

it doesn’t have an active com, it only activate when requested by the operator.

Great progress. Well done tracking it down to this one chart.

Does it have a delay in the first block, the Post Run data fetch & Calculations block?
All the loops point back to that one place, so that would be the spot to have a ~100 msec delay.

Its an odd thing to say, but ‘Adding delays speeds things up’ really is true.

1 Like

Thank you so much.

I went with your recommendation and added 100 msec delay to that block (which has only two lines of code in it), CPU now down to 75% to 80%.

This so weird to me. I would love to understand why just small amount of delay could have such a significant impact on controller’s behavior?

I really appreciate your support with this matter, not my first post where i got my questions answered.

while(true)
{
	DoSomething(); //CPU will be real busy here all the time, so less time to do other things
}

vs

while(true)
{
	Sleep(100); //Give the CPU some rest here so it can do other things
	DoSomething();
}
2 Likes

@philip gave a great OptoScript example, lets look at a visual example…

This simple chart is exactly the same as your chart was.
Lets take a look at whats going on here…

image

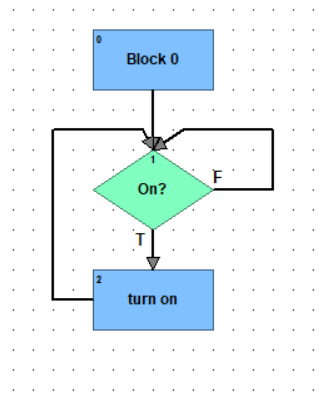
Until the operator turns the button on, the CPU will be going at 100% asking isiton?isiton?isiton?isiton?isiton?isiton?isiton?isiton?isiton?isiton?isiton?isiton?isiton?isiton?isiton?isiton?isiton?isiton?isiton?isiton?isiton?isiton?.....

There is no time to breath, the CPU is just frantic in a very tight loop doing every instruction as fast as it possibly can.
It never releases the CPU for any other task, be it another chart or I/O read/writes or other file system functions, you are telling it to check that On status 100% of the time.

Once the operator turns it on, the CPU will then be 100% busy saying isiton?YesTurnItOnisiton?YesTurnItOnisiton?YesTurnItOnisiton?YesTurnItOnisiton?YesTurnItOnisiton?YesTurnItOnisiton?YesTurnItOnisiton?YesTurnItOnisiton?YesTurnItOnisiton?YesTurnItOn....

Again, there is a very tight loop using all the CPU resources to do those two function blocks over and over and over.

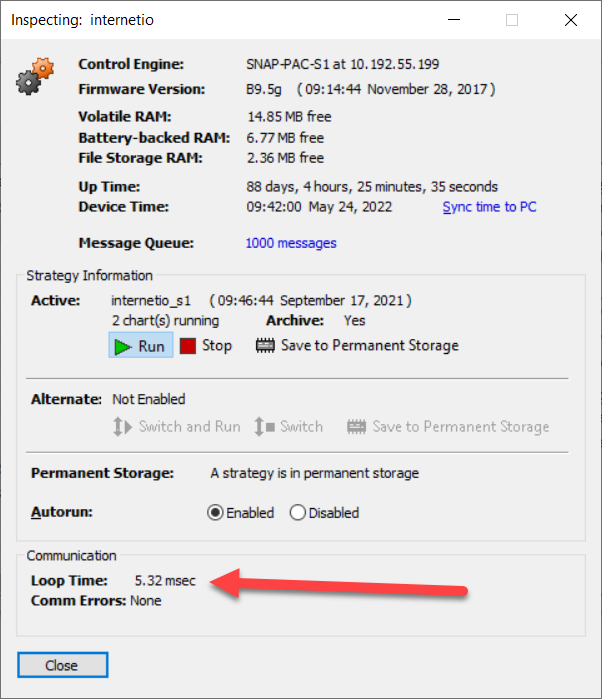
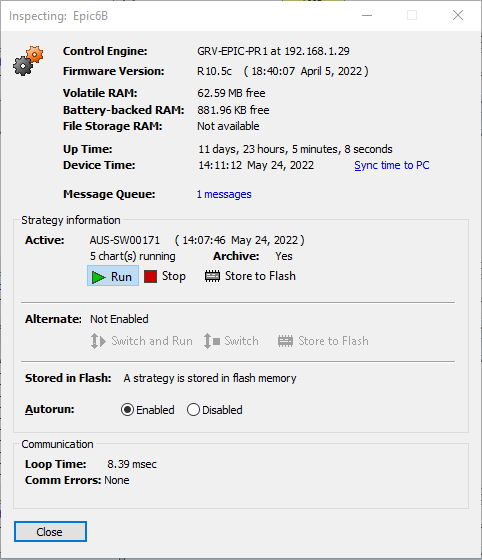
When you add the delay command you are telling the SoftPAC software its Ok release its strangle hold on the CPU and allow it to go and do other things while the delay is ticking over. The CPU then can take a breath, go off do less intense things and will keep track of the delay time and come back to the chart when the timer expires.
The FactoryFloor, ioControl and PAC Control manuals recommend at least a 1msec delay, but in the real world you usually can spare many more milliseconds and so can gain even more speed.

In short, every loop (and subloop and subroutine) in every chart in your controller MUST have a delay in it for best performance.

Hope that was helpful and you can, just before you do a download in any controller, make a mental note to ask yourself where each chart has a loop… Do I have a meaningful delay in there?

Adding delays speeds things up.

2 Likes

Thank you so much guys.

These explanations make so much sense. Again, I appreciate your input and support with this.