This flow uses the exec node to run a top command that fetches system processes and their resource usage, then uses JavaScript to sort the data for output to a groov data store, either as formatted strings or parsed decimals, or both!
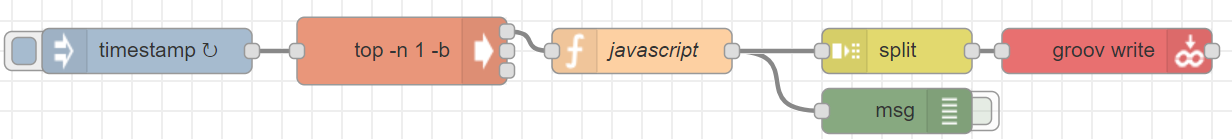
The JavaScript in the function node will separate out the general system info from the top of the command, as well as the first ten top CPU processes, and can also grab a specific CPU level to output separately; for example I set mine to search for the command ‘SoftPAC’ and parse the associated CPU usage so I can plot in groov View every time it shows up. (This is totally optional, just take out the JavaScript comment to use it.)
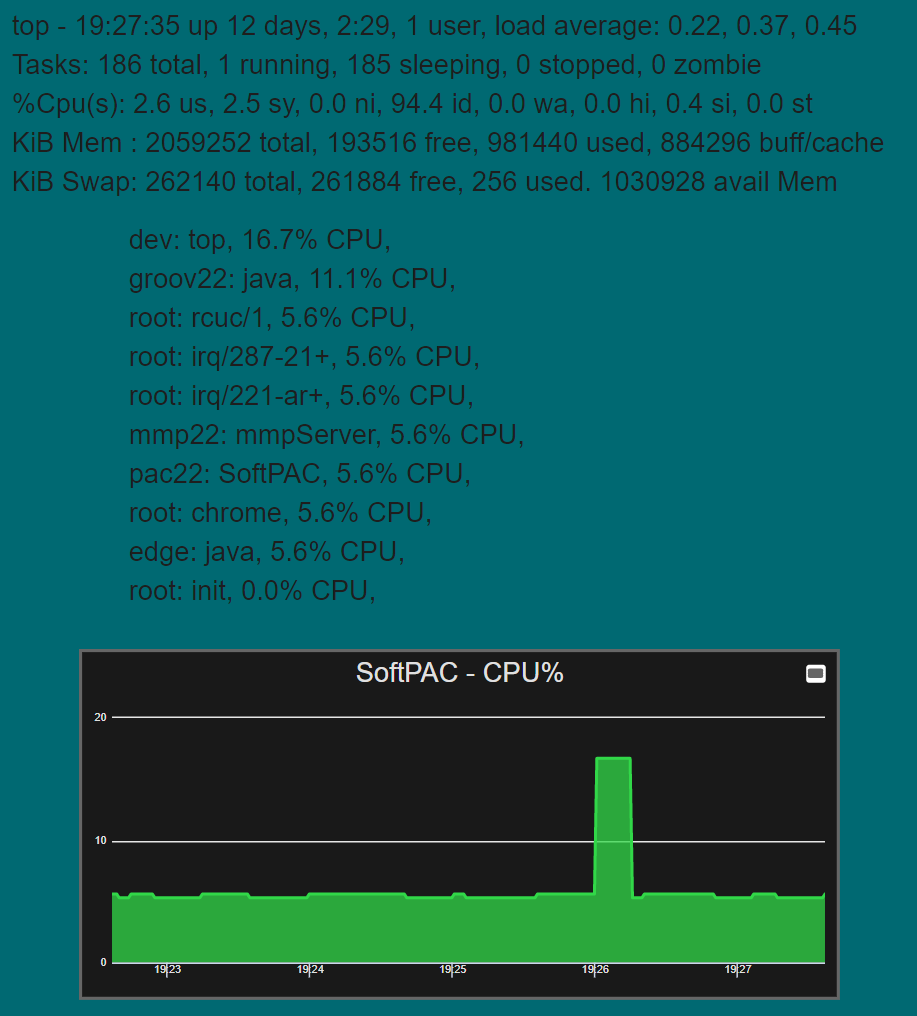
In this screenshot you can see a spike in the trend after I uploaded a new PAC strategy:
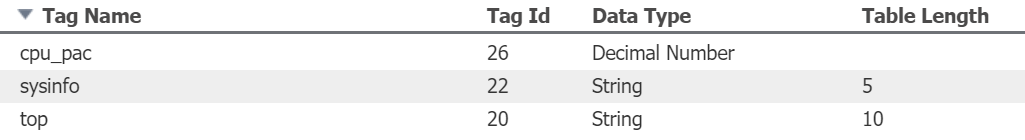
To display this in groov View I set up the following data store tags in a “NodeRED” data store to use the string table sysinfo for the top five lines at indices 0 - 4, the string table top for the ten processes at indices 0 - 9, and finally cpu_pac is used for the SoftPAC % CPU usage trend at the bottom.
Feel free to set up your groov screen however you would like, and if you want different data or different formatting in the top strings, go ahead and modify this part of the JavaScript code to use different data[] columns:
Here is the text to import the flow:
top.zip (2.0 KB)
Happy coding!