Subroutines are fun and helpful because they let you build your own PAC Control command, which you can then use over and over. Before you use subroutines, be sure to read the fabulous manual (form 1700, The PAC Control Users Guide, Chapter 12: Using Subroutines).
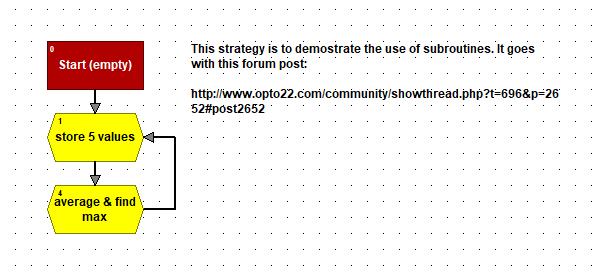
In this post I’ll show you an example, give some of the pros/cons to using a subroutine vs. not, and cover some of the more subtle points related to passing parameters. This is NOT a step-by-step post, so be sure to read the “Using Subroutines” chapter for that. You can download and open the subroutine example so you can see what’s in it.
EXAMPLE - Take an average
Let’s suppose I wanted a command to calculate the average of some values in a Numeric Table. I check the built-in commands, I even check the OptoForums (lots of good samples and donated code there!), but alas, I find no such existing built-in command or subroutine.
I could write some code in my chart, but what if I wanted to use it again somewhere else, or in another strategy? I’d have to copy/paste, which is time-consuming and could be dangerous, as we talk about in this video.
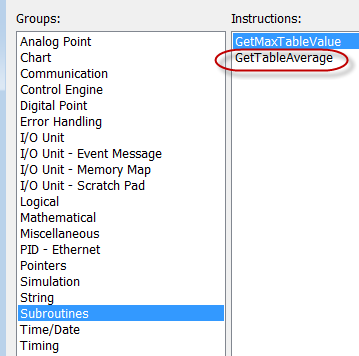
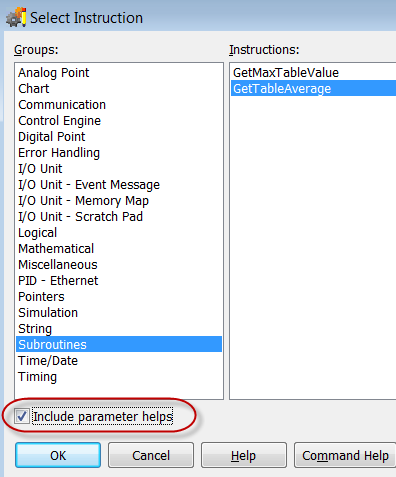
But if I put my logic in a subroutine, I can add it to a chart like a regular command. It’s shown in the list of instructions:
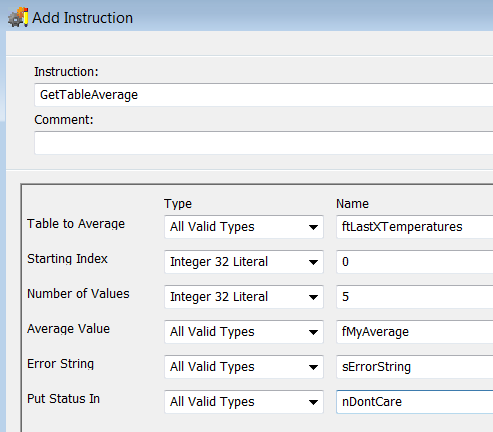
I’m even prompted for the parameters I’ve specified myself:
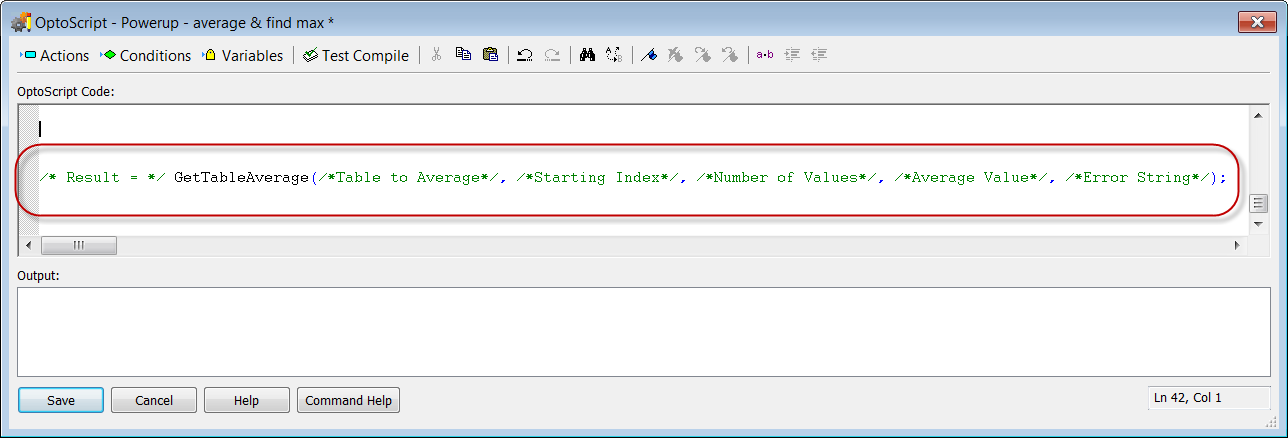
This even works for our handy “Include parameter helps” option for OptoScript users, which inserts comments to indicate the parameters required for a command:
Gives you:
Neat-o.
SUBROUTINE PROS VS. CONS
So a subroutine lets you make your own command and use it in multiple charts and strategies. As mentioned above and in the Maintainable Code video, putting logic in a subroutine makes it easy to re-use that logic later.
It also decreases your odds of clobbering variables you use in one chart while running another chart–since all strategy variables, except those in a subroutine, are global and can be changed by multiple charts running at the same time.
You can even call a subroutine from more than one chart at the same time, because each chart has its own section of memory where it runs a unique copy of the subroutine, without sharing any of its local variables with another chart.
Also, by putting logic (and its corresponding “local” variables) in a subroutine, you’ll have fewer variables cluttering up your main strategy tree: safer AND tidier!
But there are a few downsides to using subroutines.
Relative Paths
For versions 9.3 and earlier, subroutines had absolute paths with no option of relative paths. What does this mean? If you archive your strategy, send it to someone else, and/or open the archive on a different PC with a different file structure, you’ll have to tell your strategy where those subs are located. (Usually they’re all in the same place, though, so you only have to do this once.)
Note: Versions 9.4 and newer are better/smarter about paths for subroutines. When you open a strategy, PAC Control is more likely to automatically find the corresponding subs for you.
Speaking of paths and file locations–use caution when the subroutine file is located on a shared or networked drive (where the connection could be lost or files get locked up while “sync’d”). I’d recommend keeping all your strategy files on your local hard drive while you’re working with them. When you’re finished, make sure you back up the archive to a safe place, including on the SNAP PAC controller itself!
Only One Deep - until 9.5
If you’re using PAC Control software and PAC firmware pre-9.4, you’ll have this “only one deep” limitation: unlike a chart, you can’t have a subroutine call another subroutine in PAC Control. That means if you already have some code you’d like to make into a subroutine, but that code calls a subroutine, you’ll need to copy all the logic into one big subroutine. For example, if I wanted to use this 64-bit encoding sub in another sub that needs to do this (perhaps to control an IP camera that expects an encrypted username/password), I just have to copy the relevant blocks into my new subroutine. Again, not a big deal, just a bit inconvenient. But if you have 9.5 firmware/PAC Control, you CAN have subroutines call subroutines, so perhaps that’s a good reason to upgrade!
Type Limitations
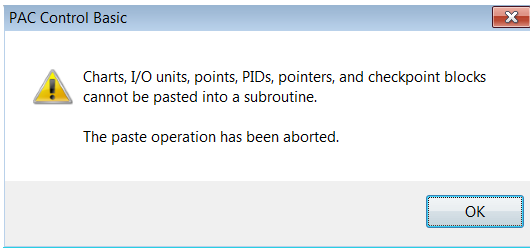
You’ll notice when you try to copy some logic from a chart to a subroutine that not all types can be pasted directly into a subroutine. Also, some types cannot be passed into the subroutine.
If you’ve copied some blocks from a chart and try to paste them into a subroutine, and they include one of these types, you’ll get this friendly reminder from PAC Control:
Note you CAN pass a pointer table to a subroutine, which can be especially handy if you have a large number of values to pass in (more than the max of 12 parameters).
Let’s have a look at what you CAN (and should) do with passed-in parameters.
PASSING PARAMETERS
If you copy logic from a chart into a new subroutine you created by selecting Subroutine > New, you’ll get a Paste Report which is very similar to what you’ll see when importing a chart into a strategy.
This is a good time to decide which of those variables should be parameters that are passed into the subroutine by the chart that will call it, and which should be variables that are used only locally within the subroutine and don’t correspond to anything outside the sub.
For example, to calculate an average of some elements in a table, I have a running total called fRunningTotal where I’ll add up all the values I want to average, before I divide it by the total number of values, to get the fAverageValueToReturn.
That fRunningTotal variable is just for temporary use in the calculation, so it should be strictly local. On the other hand, the fAverageValueToReturn value is what we need to return, so it MUST be a passed parameter (and can’t be a literal; more on that later).
PAC Control has this handy feature where, if you name your new passed-in parameter with the same name as one of those existing variables, it will ask you if you want to convert it!
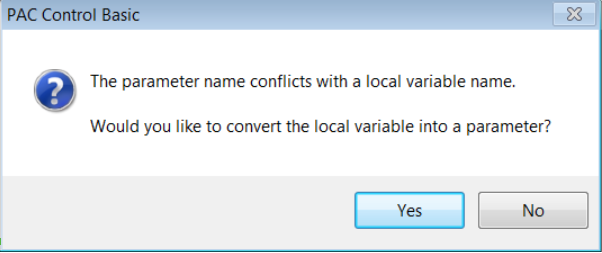
Neat-o!
While we’re on parameters, let me highlight an important point mentioned in the manual:
Although most variables passed in and out of a subroutine must be of a specific type, literals that are passed into subroutines can take several types. Using a string literal, you can pass in either a string literal or a string variable. Using a numeric literal, you can pass in an analog point, a digital point, an integer variable, a float variable, or a timer variable…This flexibility in using literals makes it easier to use a subroutine in multiple strategies. For example, a literal passed into a subroutine from two strategies might be a float value in one strategy and an analog point in the other.
Mary’s rule of thumb: always make a passed parameter a “literal” if you can.
Let’s look more closely at this GetTableAverage example.
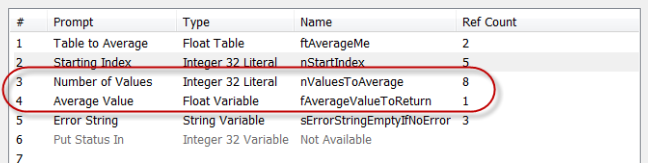
Let’s consider a couple of the passed parameters circled above. The Average Value (#4) is the point of this whole function–what the subroutine calculates–so I can’t pick literal there. I have to pass in a variable that will get filled in by the subroutine.
The Number of Values to average, however, is not something that this subroutine will change. In fact, I might want to just pass, say, a literal 10 to the subroutine vs. a variable with the value of 10. If I choose a non-literal type for that parameter, I’ll HAVE to create a variable of that type in any chart that calls this subroutine. But if the parameter is a literal, I can pass in more than one type, so one chart can pass in an analog input and another a float or integer.
If I’m using OptoScript, I could even pass the return value of the call to another command, as shown here:

Okay, now that we’ve passed some values into the subroutine, let’s see how the sub is actually put together. Here I’m doing a simple average, which can be done in just a few lines of code (as I do in OptoScript in the guts of this GetTableAverage subroutine):

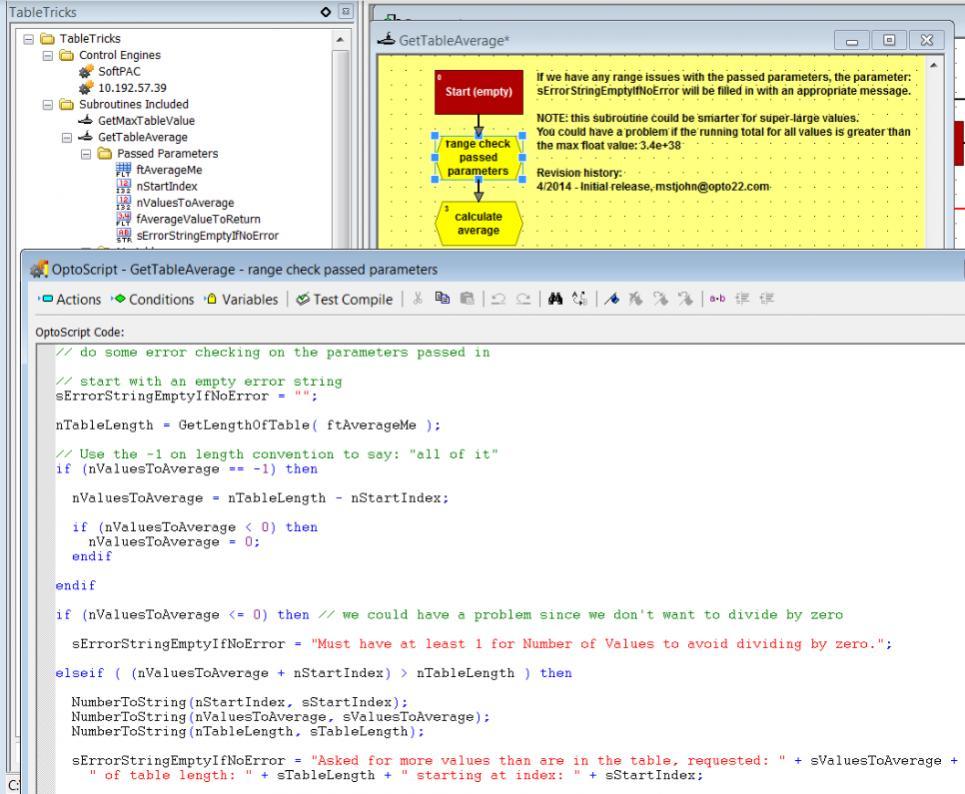
But in the subroutine I add lots of comments and more OptoScript before I do the actual calculation, so I’ll have more control over things that could possibly go wrong. Error handling is a whole topic in itself, but you can see some of what I’ve done in the example. For one thing, I’ll return a string which tells what went wrong.
Because this subroutine with its literal parameters can accept all kinds of different inputs and could be called from all kinds of charts or strategies, I’ll take special care to anticipate potential problems that would mess up an average. For example, if we average 0 elements we could get a divide-by-0 error. Or if we request a range that goes off the end of the table passed, we’d get another error. In both of these cases, you’d end up with errors in the message queue which could mess up any message-queue handling logic you may already have in place.
I’d also like to make my life easier by adding the -1 option for the “Number of Parameters” value, like we have in many of the built-in table commands, to say: “give me the whole thing.”
That’s all handled here in the first block of my subroutine.
One final side note: I like to make the backgrounds of my subroutines yellow to distinguish them from charts. And because we love to have a yellow subroutine! Har!
Oh, and did we mention a certain green submarine uses subroutines too?
Double neat-o.
-Mary
Example strategy: (requires R9.3 PAC Control Basic or better) TableTricks.Archive.D04292014.T162343.zip (8.19 KB)