I’m using a SNAP-PAC-R1 controller. The project I created ran on Firmware 9.4b and loader 6.1b and using PAC Project Software Suite 9.4. PAC Display runtime would refresh the color of a button I created based on a numeric value received. It lags about 3 seconds before the color updates, even though the group refresh value is 50ms. But that’s a different problem to figure out.
Once I loaded the latest firmware, R10.4c, and loader R6.2c and used PAC Project 10.4 and ran the project, my PAC Display runtime lags about 10 seconds before the color updates. I can deal with the 3 seconds for now, but 10 is definitely unacceptable.
Is there a reason the update of firmware/software is causing the runtime to act so slow? Is there a way to remedy this?
Make a firm note of the tag variable name in PAC Display that you want to test/debug.
If possible, shutdown PAC Display Runtime - other wise, leave it running, but ignore it for the next little while.
Go into debug in PAC Control and inspect that variable name. Note its update rate.
If its updating at rate expected, then you have narrowed it down to being a PAC Display or PAC Display computer / network issue.
If the variable is only updating every 10 seconds in PAC Control debug, then you need to review your strategy logic and see why its not updating at the rate you expect.
Note all charts should must have delays. If you have not already carefully reviewed the PAC Project System Performance guide, please take a moment and read it deeply and carefully.
Once the variable is updating at a reasonable rate in PAC Control and your PAC Terminal comm loop time is as expected, then you have narrowed down the issue (I very much doubt it is a firmware update issue) and can proceed with further debugging.
In my limited experience with issues surrounding tags and variables updating slowly in Display Runtime, I find it’s mostly software/windows related.
There are a few threads around the forum with tips and tricks to resolve such issues.
It’s probably pure coincidence that you loaded new firmware etc and this problem popped up. You might find Microsoft decided to creep into your office during the night and do one of those sneaky updates that throw many IT teams 8AM curveballs and panic sets it. It’s a painful process of elimination but is eventually (usually) resolved by taking all the suggested steps.
Thank you for the tip! It seemed my comm loop time without PAC Display Runtime running is ~50msec. However, the second I open PAC Display Runtime it shoots up to like 550-800msec or higher and now is having timeout errors/comm issues. I checked the tag variable that updates certain display components in PAC Control and it updates every 1-2 seconds, which does not match the ~10 second Display refresh time that occurs. While running PAC Display Runtime, the tag variable in PAC Control keeps its 1-2 second update time. So it seems my issue is with PAC Display…with no real clue on where to start looking that could cause such a spike like that.
50msec is Okish, it could be a lot less (hint, add more delays to your charts), but it’s not horrible.
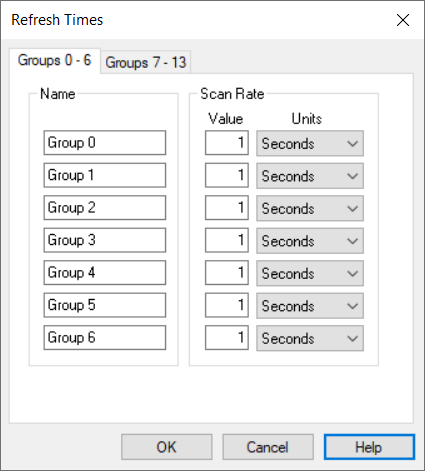
PAC Display refresh time is a default of 1 second for all groups:
It sounds like you have all your controller tags connected to graphic elements that are under Group 0.
When you start PAC Display, every single graphic tag is now being pulled from the controller at once a second and so your Comm Loop time craters as it is slightly overwhelmed by PAC Display asking for everything once a second.
I always have the habit of using prime numbers for my group scan rates and making sure I use at least 4-5 groups on every page. Hint, not everything needs to be scanned at once a second.
550 to 800msec is indeed a terrible comm loop time, but you now know the reason and can focus your time on the PAC Display scan group times and tags connected to each group.