Since releasing groov View 4.3a, the most common feedback I’ve heard about the new average/min/max display in Interactive Trend gadgets has been “how do I turn it off?”, which I take to mean that either people don’t want it, or don’t understand what it’s doing. Assuming I haven’t explained it well, here’s another crack at it. 
Quick bit of history to start: when groov 1.0 launched, trends were up to an hour long, scanned once a second, and stored no data on the server. If you refreshed the page, it would start over from scratch. Honestly, all they really did was set an expectation that you could have a trend with up to 3,600 points on it. (60 minutes * 60 seconds)
In groov 2.2 we reworked trends to support up to 4 pens per gadget, run for up to a week, have configurable scan rates and to store data on the server so it’d already be there when you loaded a page. We used that 3,600 points as an upper bound on how many points we’d support per pen, so if you extend your period out, you have to use a larger scan rate as well. Even 3,600 points was pushing it: there were plenty of low-powered phones at the time that struggled with it, but we had that expectation to keep.
In groov 3.4, we extended the maximum trend period out to 5 years. It doesn’t really matter what the sample rate is at that point, there’s no way we’re going to display that much data interactively in a web browser on a phone.* Too many points, and if we try and show all of it, it’ll be too dense to be useful anyway.
So, we downsample. When you configure an Interactive trend, we capture data at the sample rate and period that you request, but at the same time build a set of parallel data buffers that hold more and more coarse representations of the raw data. Those downsampled buffers are built by averaging together consecutive data points from the raw set.
When you select a range of data in an interactive trend, the server picks a data buffer that gives you a reasonable density for the points in your trend. (We aim for about 700 points visible, and pick the buffer that gets us closest to that.) That presents a problem though: the larger the time range you select on your trend, the less accurate the trend is going to be. In particular, you’re going to miss peaks and troughs in your data. That was a frequent point of confusion, and product support fielded a bunch of calls about it.
We anticipated that being an issue, so along with the averaged data points, we’ve also been keeping track of the minimum and maximum values for each downsampled point. Those minimum and maximum values are what you’re seeing now in groov View 4.3: we display a shaded area that shows the full range of values recorded for each tag, with the average shown as a solid line on top of it.
So, an example. I configured a trend to record a couple of reasonably noisy tags for 2 weeks, sampled once a second. That’s 60 × 60 × 24 × 14 = 1,209,600 points per tag, or 2,419,200 points total. No way I can display all of that once and show you live updates, and it’d be meaningless anyway: your screen isn’t dense enough to show that much data.
Here’s what it looks like when rendered in groov View 4.2, after selecting a 2 hour time range:
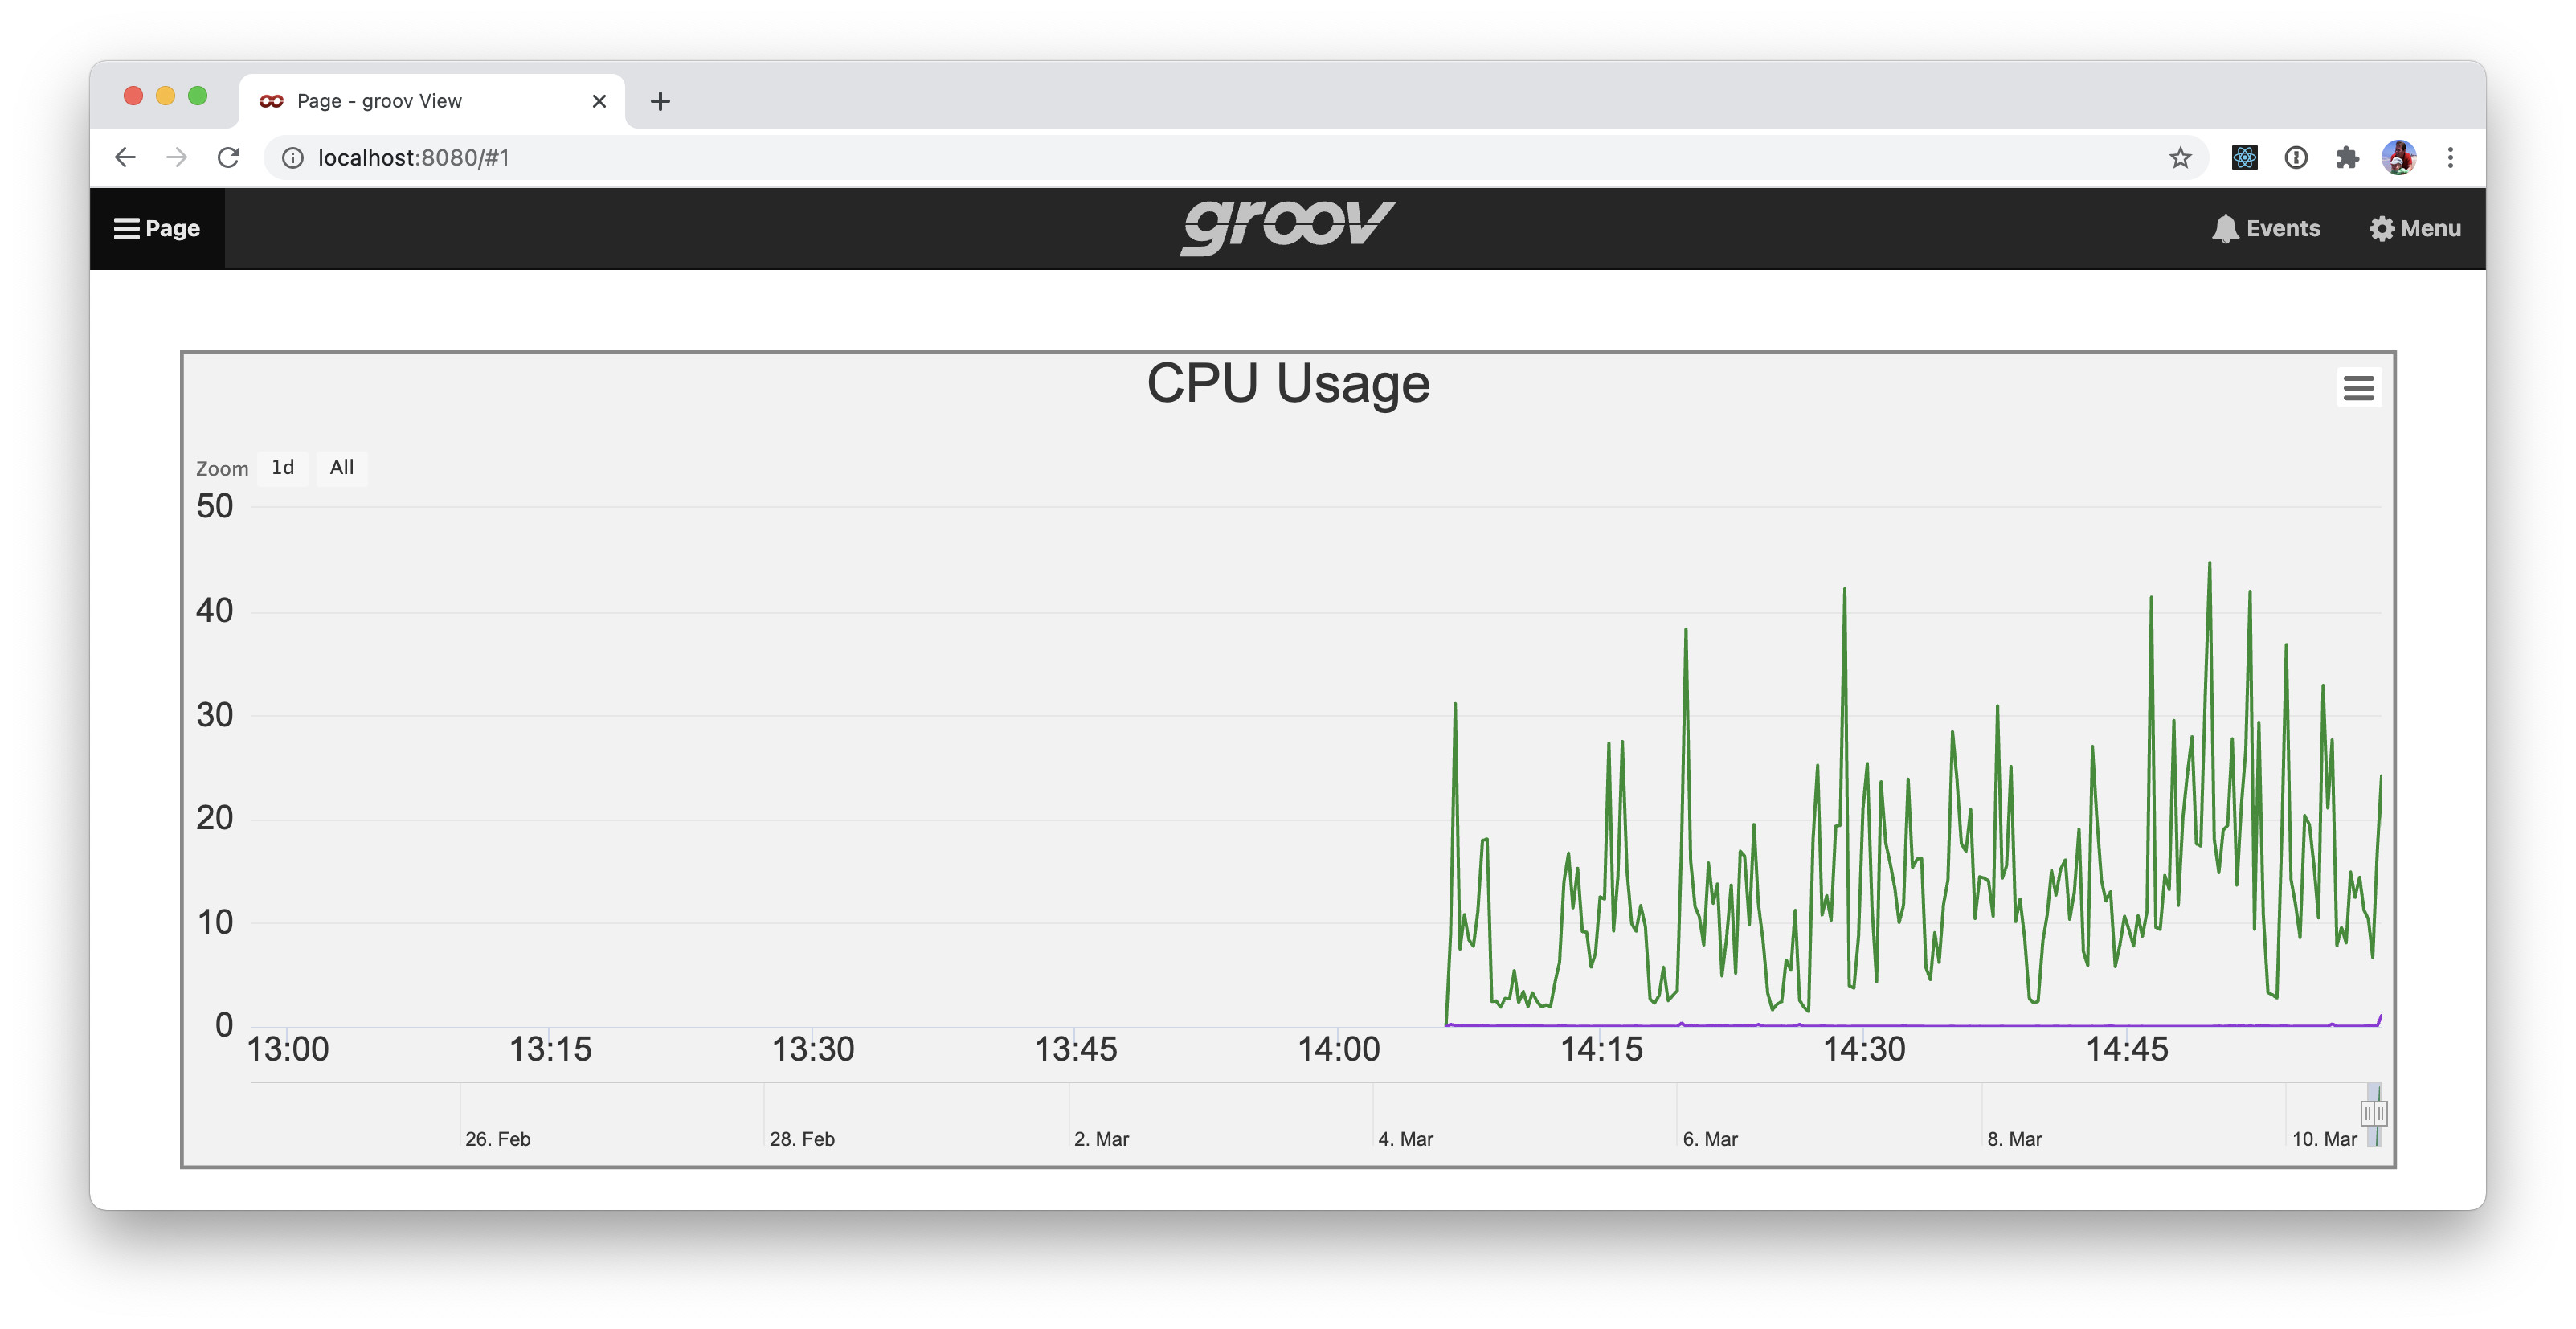
At that time span, it’s not showing the raw data anymore, but you can’t tell: I only know that for sure because I peeked at the network traffic.
Here’s the same trend in groov View 4.3, showing about the same amount of time:
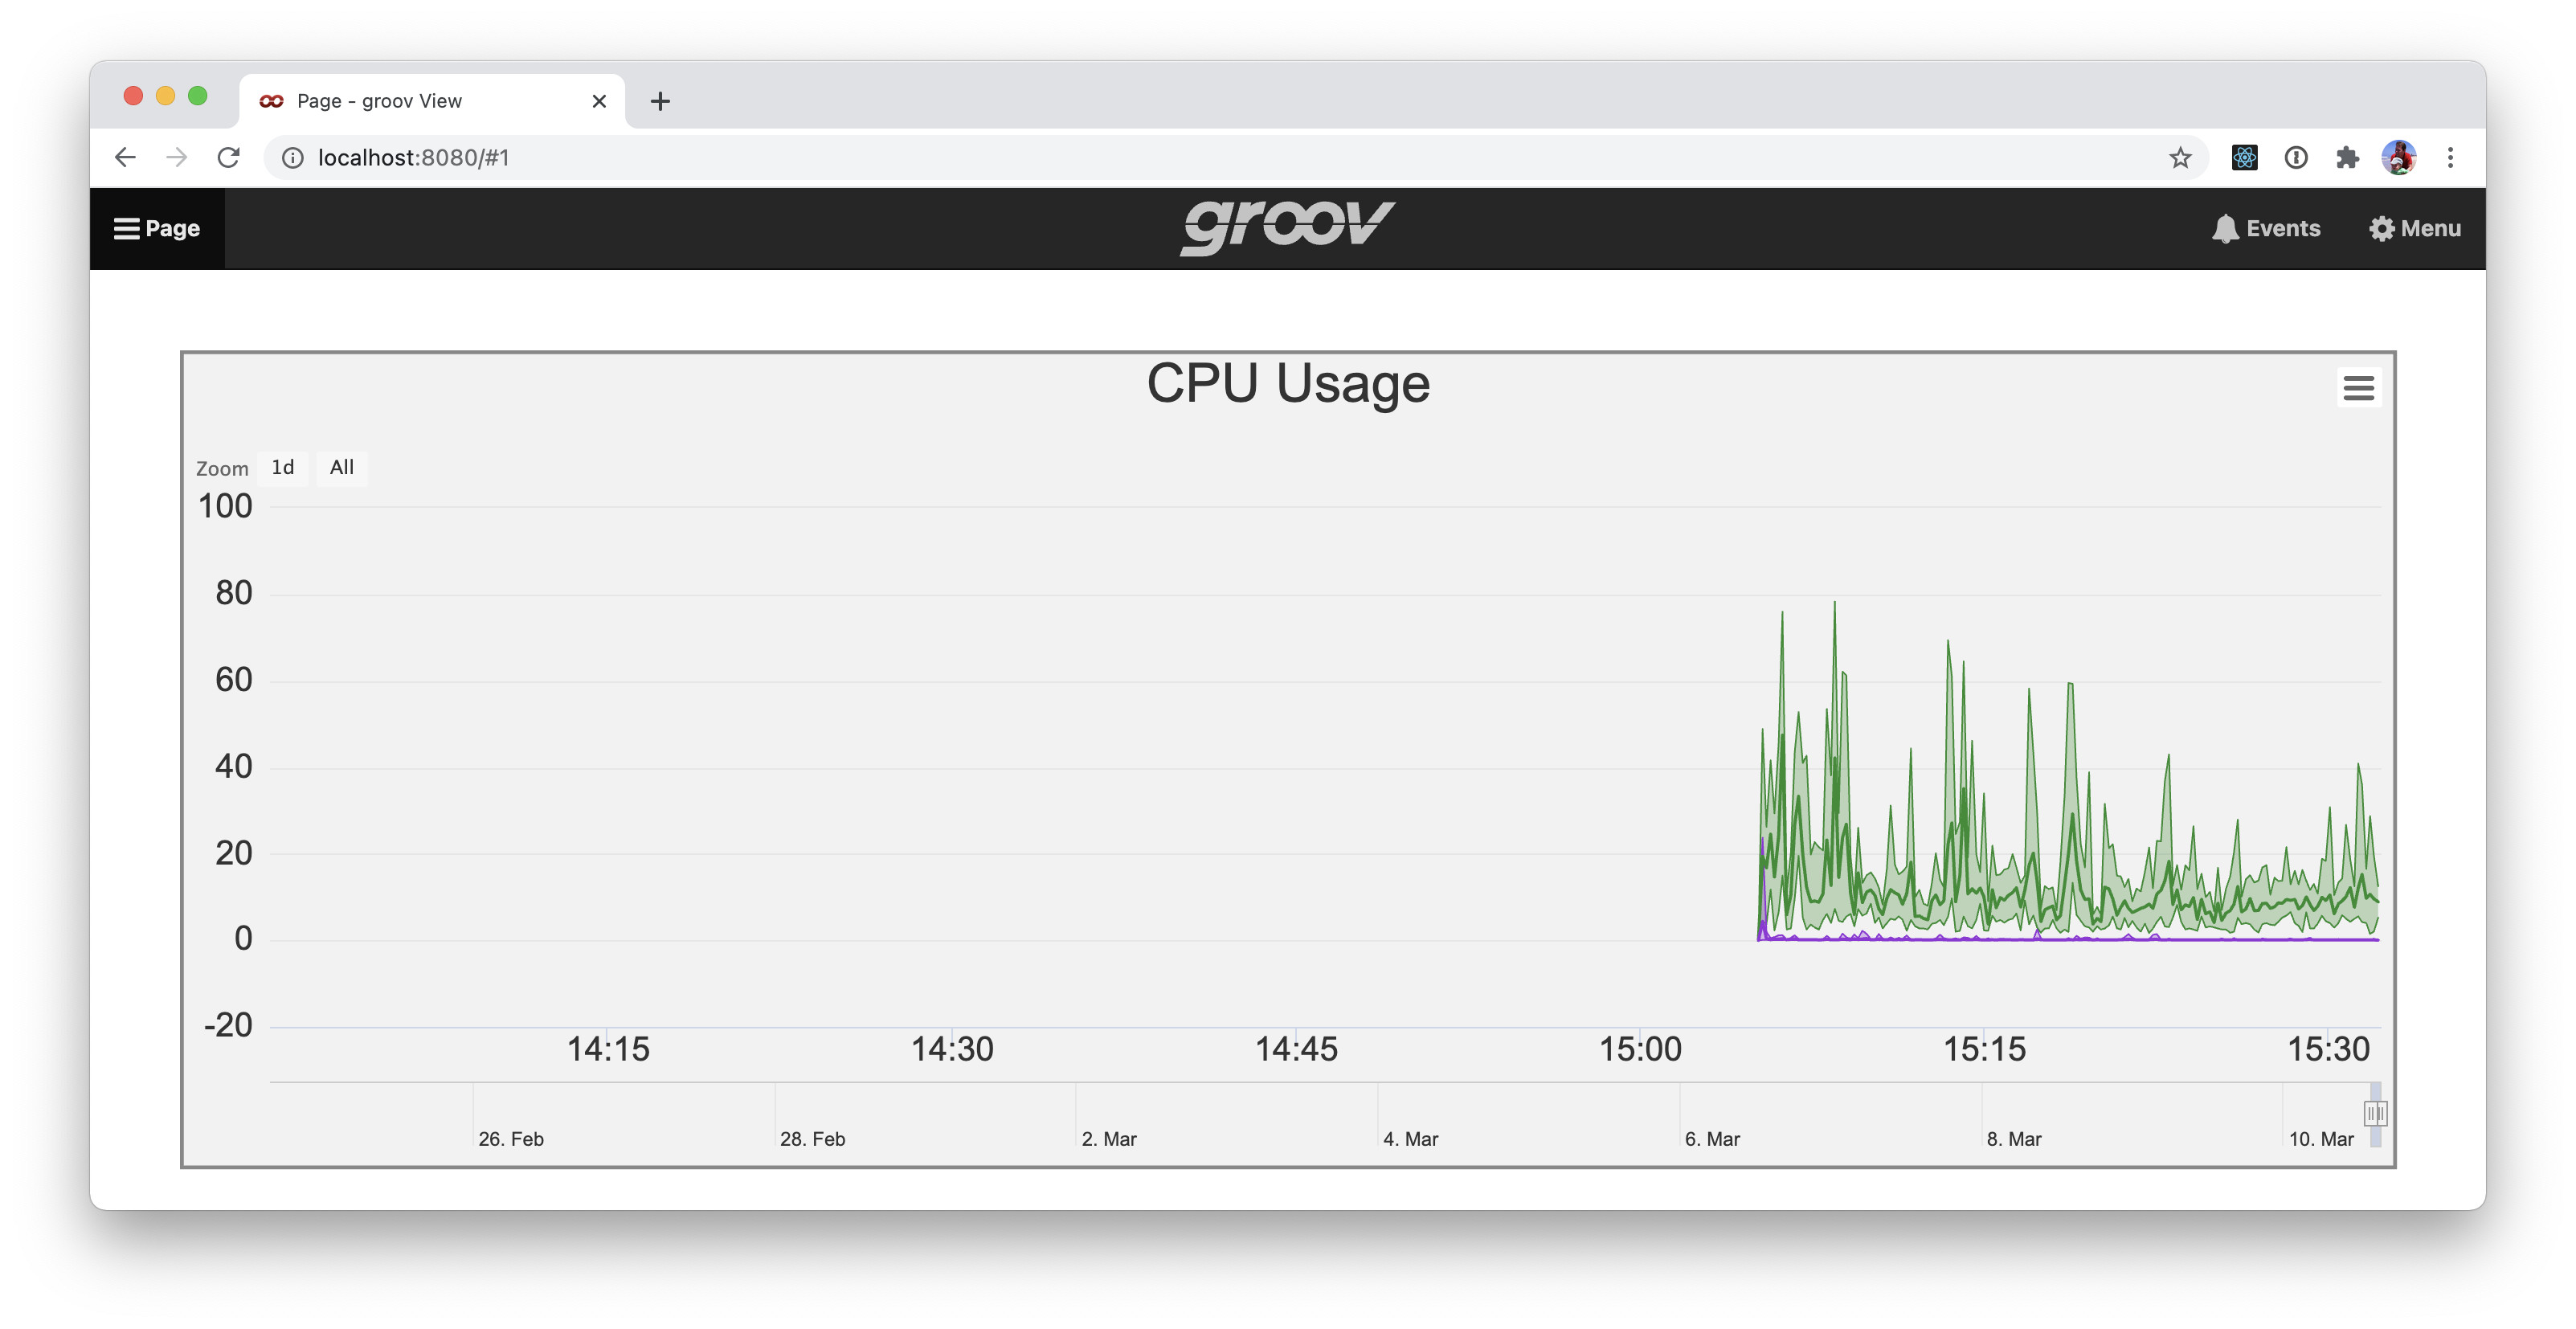
Same data, and you can still see the average line from before, but now you can see the peaks and troughs that were missing in earlier versions.
So that’s what the new average/min/max feature is. It lets us show you the full shape of your data as we switch to more coarse representations in order to keep it rendering at interactive speeds.
*For reference’s sake, I use an iPad 2 / first generation iPad Mini as my device baseline. They’re popular as kiosks, and since iOS 7, they’re slow as molasses.