When I’ve configured groov Trends in the past, I’ve used “Custom” e.g. min/max range of 0 to 2 when I wanted my axis to be fixed, e.g. when I wanted to display a value of 0 or 1 and I always saw just a 0, 1, and 2 on that axis. But now I’m learning that it might not always stay fixed at those values. Perhaps we need a third “fixed” option?
Here’s the situation/question for a customer that saw those values stay fixed for MOST of the time…
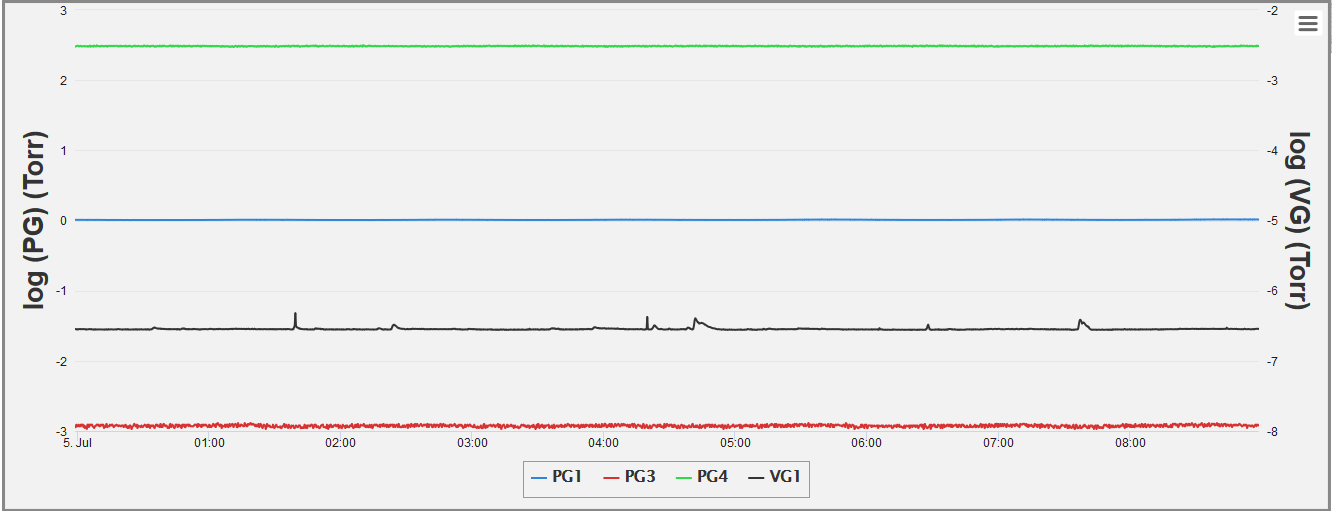
“I wish trend’s in Groov could deal with logarithmic data (on the vertical axis). But since it doesn’t I converted the data in my R2 and it works great most of the time, this issue is when the vertical scale is “adjusted” to non-whole numbers even when using a custom axis. I did get super lucky and it scales to whole numbers on phones in both orientations. Can you think of any ways to increase the chances of it scaling to whole numbers for more window sizes?”
“I am using ‘custom’ setting. Below are images of my trend, as you can see at certain window sizes the vertical scale is not whole numbers. I have tried building a trend with all the numbers are on the left side but still have the odd times that I see a scale .5, 1, 1.5, 2, 2.5… The lucky thing is that it works (whole numbers only) on smart phones 99% of the time.”
Images:

I’m not sure if odds of getting those same whole numbers will vary depending on the config of the other axis.
Also not sure why the ranged doesn’t stay fixed like with other gadgets that have min/max.
Best case, in my opinion, is if we also had options like we do with the Round Gauge and Range Indicator to customize e.g. with the Markers’ minor and major indicators, even color ranges to easily indicate “too high” and “too low” lines. Perhaps these could go with an additional option (besides the “custom” and “auto”) of “fixed” that would include these additional options.
While I’m wishing for things here, besides the customer mentioned above, anyone else out there in optoland wanting to trend logarithmic data, too?
Thoughts?
-OptoMary