I see all these wonderful Groov demos which have these great pipe graphics. Anyone have a source for those? The SVG library only has a straight line and a right-angle. I’m using the duct ones at the moment but it would be nice to have something with a 3D look.
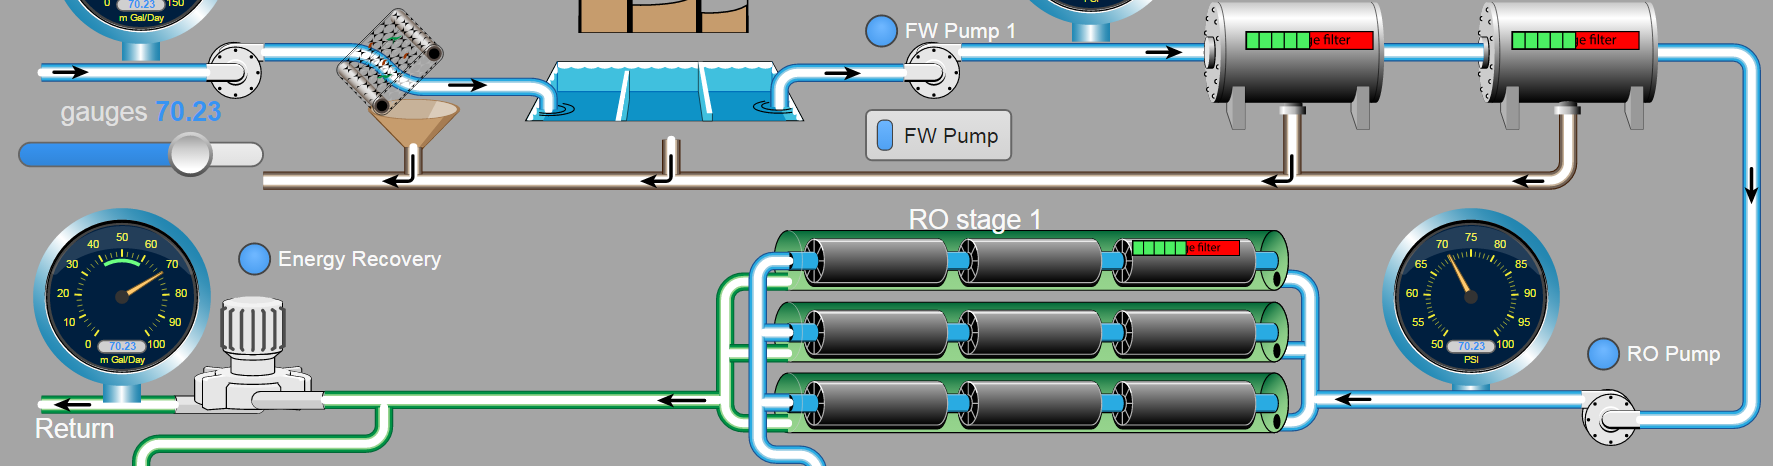
A new category of images based on the pipes in this screen capture have been added to the image library at groov.com (under the Support menu). There are basic pipes, elbows, junctions,simple tanks, a pump, valve, and meter. The images will have their parts line up even when scaled. I’ll be fine-tuning and embellishing this library, so I’m open to suggestions for images to add.
I’ve also found the if a graphic or gadget is off alignment, you can increase or decrease the size to change the alignment a smaller amount than the grid
John. How did you get the flow arrows in the middle of the pipes to show fluid direction? Especially the right angles flow arrows. I can¡'t see how to get these from the available options in the symbols section.
Referring to the groov gadget library instead of the svg library, how about introducing alternative gauges. The completely round circular one is the only option that has been available since groov release 1 and is not suitable for every occasion.
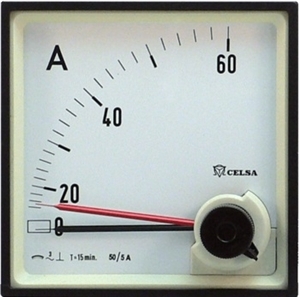
Ej. For electrical purposes, something like the below with configurable scale for 90º needle movement, text units and safety point indicator would be much nicer for voltage and current meters
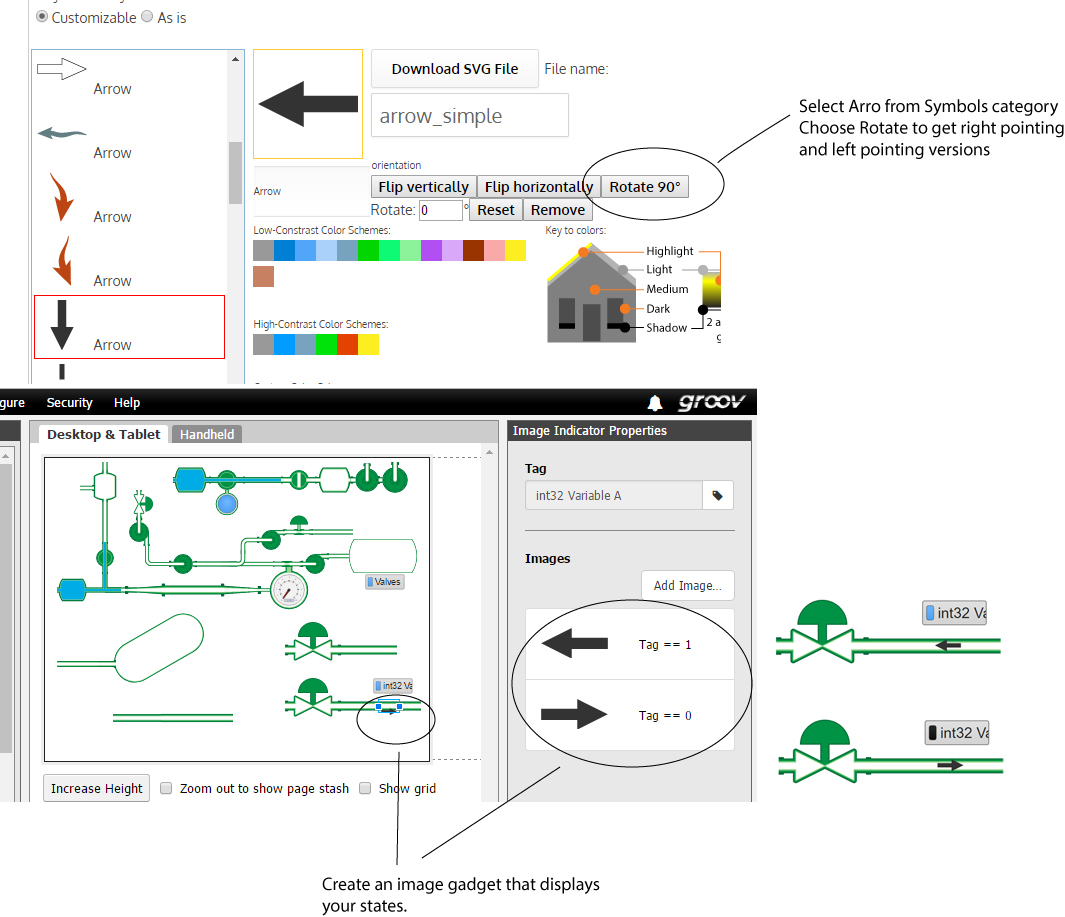
I’ve attached a diagram of the steps. You can get the arrows from the SVG Library. The arrows are in the Symbols category. Select the arrow you want, then use Rotate 90 to get it pointing right, left, up, or down. Then download the image. I did this for a right pointing and left pointing arrow.
Next, use groov to create an image gadget. Place the gadget over your pipe. Assign each graphic to a state for you variable.
The arrow I chose lines up pretty well, but I didn’t create these arrows with a transparent border to ensure exact centering. I’ll correct this oversight. If I create an arrow so that it is guaranteed to align with the pipe graphics, then the same arrow my be inflexible when you try to position it near the edge of the page. So, when I create more arrows, I’ll leave the existing ones in the library.
So what is your opinion of a standard Amp/Volt scaled meter, with alarm limit needle? There are a lot of applications out there for this in electrical distribution. We actually had this way back on OptoDisplay. It could look real nice on groov
First, I should correct what I just said. I draw illustrations for the SVG library, and I also built the SVG Library program, so I handle anything it does to a graphic. groov’s widgets are built by others here, so if my poor choice of words suggested I could accelerate the development of the meter as a gadget, forgive me. But, I do think the meter you shared would be an asset to groov.
I would be happy to create some artwork in the SVG image library that would allow you to create such a meter. Here’s how it would work: I’d create a background graphic that you’d put a scale graphic on, selecting from a variety of scales and a variety of resolutions. E.g., 1-10, 1-100, 1-60. I welcome a suggestion of common scales. Then I’d add a needle. By using the rotate feature of the library, you can export needle images at various positions to correspond to the values being displayed.
Appreciating that this can be done with the SVG library, but was looking for a configurable gadget within Groov Build. Animating those needles is a lot of work for the end user using the SVG library.