If you have a value in one range, for example an input that varies from 25-75, and want to rescale or remap it to a different range, for example outputting from 10-110 (or any other two arbitrary ranges) then this is the forum post for you.
Note: Before I dive into this example, I want to be clear that this isn’t just for groov View computed tags – it’s “just math”, so you can use it anywhere capable of calculating the basic math operations. This includes OptoScript in PAC Control, Node-RED, or even custom scripts. I’m just using it as a way to show how groov View computed tags can be used to calculate and display a remapped value.
Here’s the formula:
output = low2 + (input- low1) * ((high2 - low2) / (high1 - low1))
So the input range goes from low1 to high1, and the target output range goes from low2 to high2. With the example ranges I referenced above (input is received between 25-75 and remapping the output to 10-110), the formula would look like this:
output = 10 + (input - 25) * ((110- 10) / (75- 25))
I won’t go in-depth on how this formula works, and of course this can be mathematically simplified, but using dynamic variables, constant values, or a simplified formula will all provide the same results.
Just be aware that the parenthesis are very important even if you choose to simplify the math, since without them your program will not follow the correct order of operations.
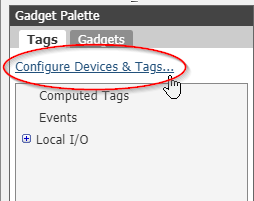
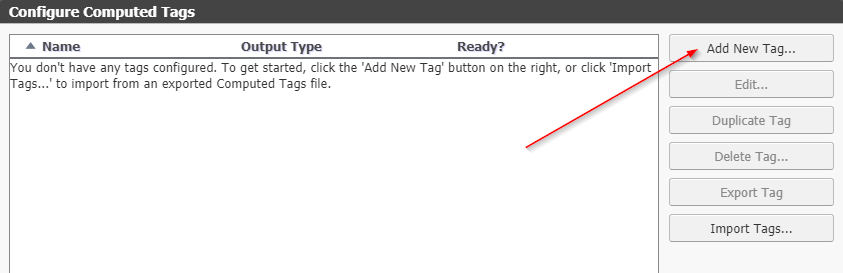
With all that out of the way, let’s go over the setup for using this formula as a groov View computed tag. First, go into groov View build mode, then go to Configure Devices & Tags in either the top Configure menu, or the link in the gadget palette.
Once you see the pop-up, your next step depends on where your input will be coming from. It could be anything from PAC Control, some I/O value, or you can use a groov View datastore tag like I will for this example. (Later in this post I’ll also show how you can use variables for low1, high1, low2, and high2 as well so you can easily set the two ranges dynamically.)
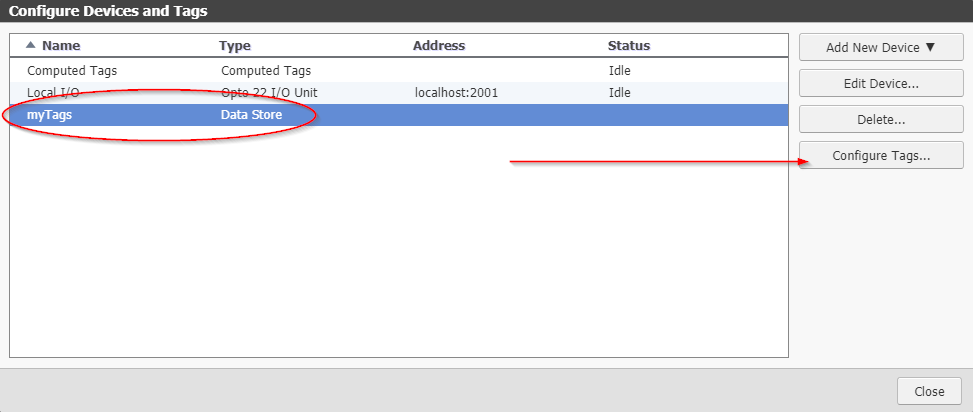
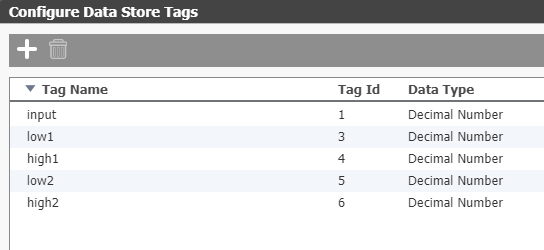
You can skip this step if you’ll just be using I/O or a PAC Control variable, but to use a groov View tag you’ll need to start by creating a datastore. In my case I’ll be creating one called “myTags”:

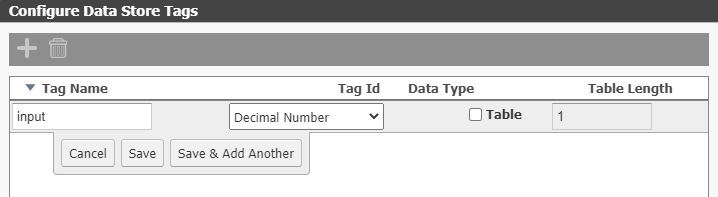
Once that’s done just select the datastore and then click “Configure Tags”:
It’s possible to rescale an integer, but I’ll be using a decimal number. Just make sure you change it from the default boolean data type.
Once you have your input, it’s finally time to select “Computed Tags” to configure the output value and provide the formula. (Note: Once you’ve created this computed tag you can export it to easily back-up or distribute the configuration to other systems to save time.)
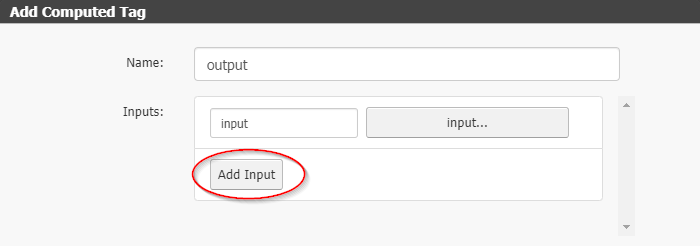
The main configuration is in the “Add Computed Tag” popup:
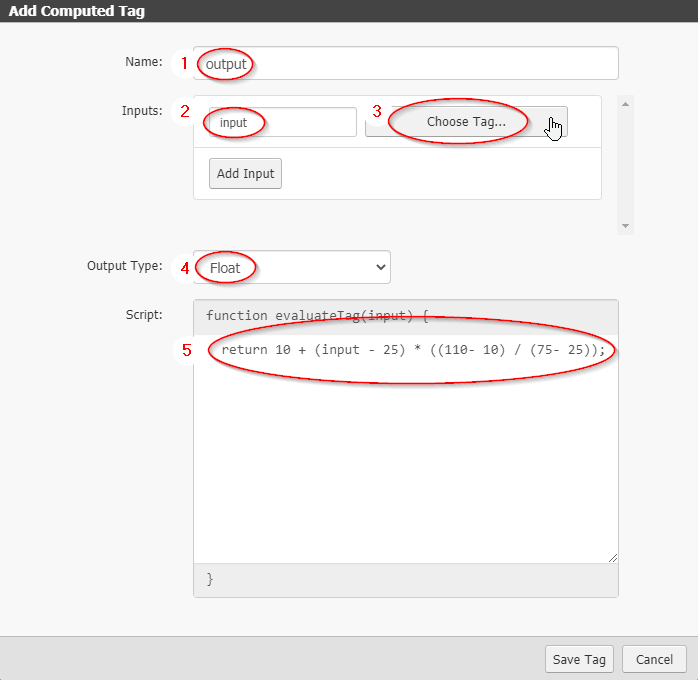
- Decide the name for the output tag. I’m using “output”.
- Decide on the name for your input.
This is what you’ll be referencing in the code script below so it can be whatever you want, but for consistency I recommend setting the input name to be the same as the tag name. - Choose the tag that’s assigned to this input, in my case that’s “input” decimal that’s in the “myTags” datastore I created earlier.
- Set the output data type. You will need to
returna value that matches this data type, otherwise your script will not work. In my case that will be a floating point (decimal) number. - Finally, put your formula in the script text area. This script runs JavaScript, so you will need to use correct JavaScript syntax, but it’s very straightforward and easy to calculate simple math equations like this remapping formula:
return 10 + (input - 25) * ((110- 10) / (75- 25));
The important thing here is to start the line with the keywordreturnand end the line with a semicolon;
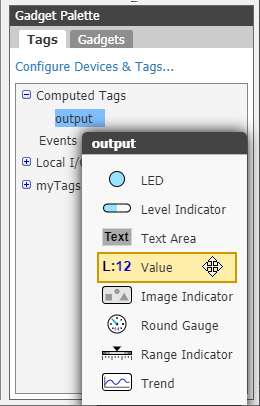
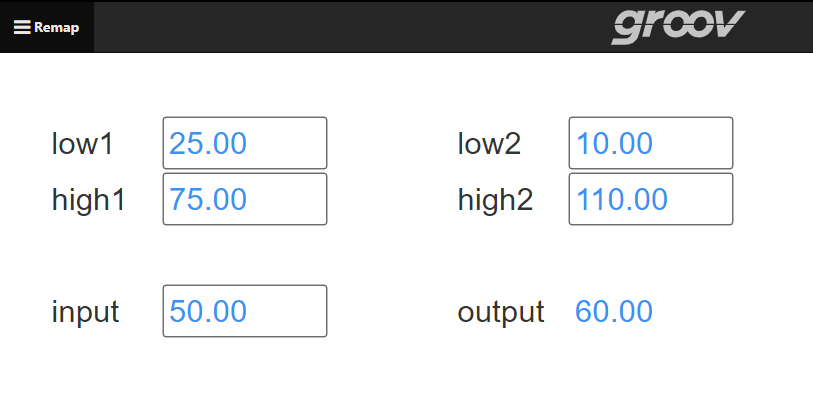
Once you’ve saved this configuration, you’re good to go! You should now see your new output in the “computed tags” list in the gadget palette, and you can do whatever you want with it. I’ll drag in a “value” display tag so that I can see the output:
I’ve also added a “text box” for the input value I made in myTags that will be the number I remap. So when I enter a value in the range of 25-75 for input, it should remap the output to the range 10-110. For example the middle of the first range is 50, so it should map to the middle of the target range, 60. Let’s test that out.
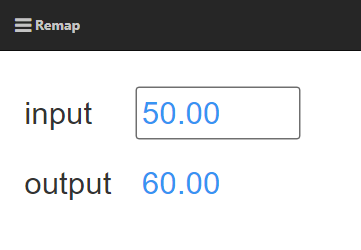
I tested some other values as well, and it’s mapping exactly the way I expected. So putting in 25 results in 10, putting in 75 results in 110, and the values in between rescale accordingly. Feel free to experiment with different ranges and see what works for you, just be mindful of the format and make sure everything is in the right place:
output = low2 + (input- low1) * ((high2 - low2) / (high1 - low1))
Now let’s use that format EXACTLY and replace each of the constants I typed in earlier with four new variables. These will all be groov View datastore tags, but just like the input value, they can come from PAC Control if needed. I’ll just add them to the “myTags” data store:
Now simply switch back to the computed tag, select “output” and then click Edit, and add each of these new tags as additional inputs:
So create an input called low1 and assign it to the tag “low1”, then do the same for the other three values. As you add additional inputs, the function title will reflect this and you’ll end up with:
function evaluateTag(input, low1, high1, low2, high2) {
Then just replace your code with the dynamic formula and you’re all set.
return low2 + (input- low1) * ((high2 - low2) / (high1 - low1));
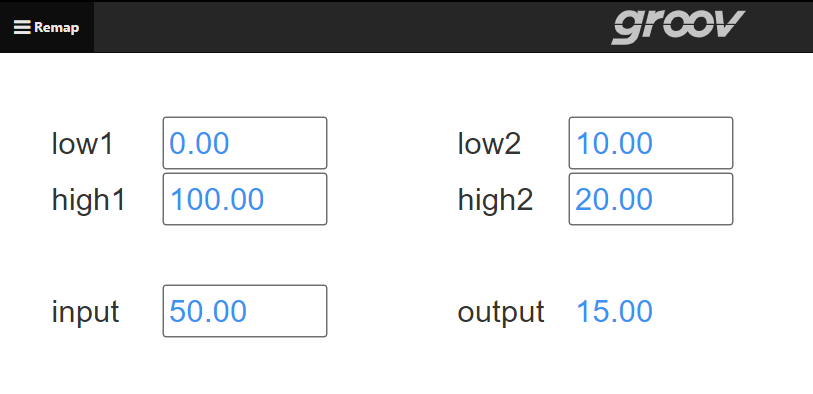
Now I can add four more gadgets for each of the new variables and I’ll be able to dynamically determine the starting and target ranges, enter the input, and see where it gets remapped to:
And another example taking values from 0-100 and remapping them into the range 10-20. The number 50 is halfway, so it should remap to 15, and indeed it does:
You can either build this yourself using the instructions above, or if you want to just dive in, try importing my groov page:
Groov_Page_D04152021.T135419.json.zip (1.1 KB)
If you find this helpful, end up using it in one of your projects, customize it for your own needs, or have any questions about this please drop a message in the thread below. And as always, happy coding!