7/6/2022 23:05:42 ApiServlet An exception occurred while handling /api/v0/data-logging/fetch-interactive
|7/6/2022 23:05:42|ApiServlet|An exception occurred while handling /api/v0/data-logging/fetch-interactive|
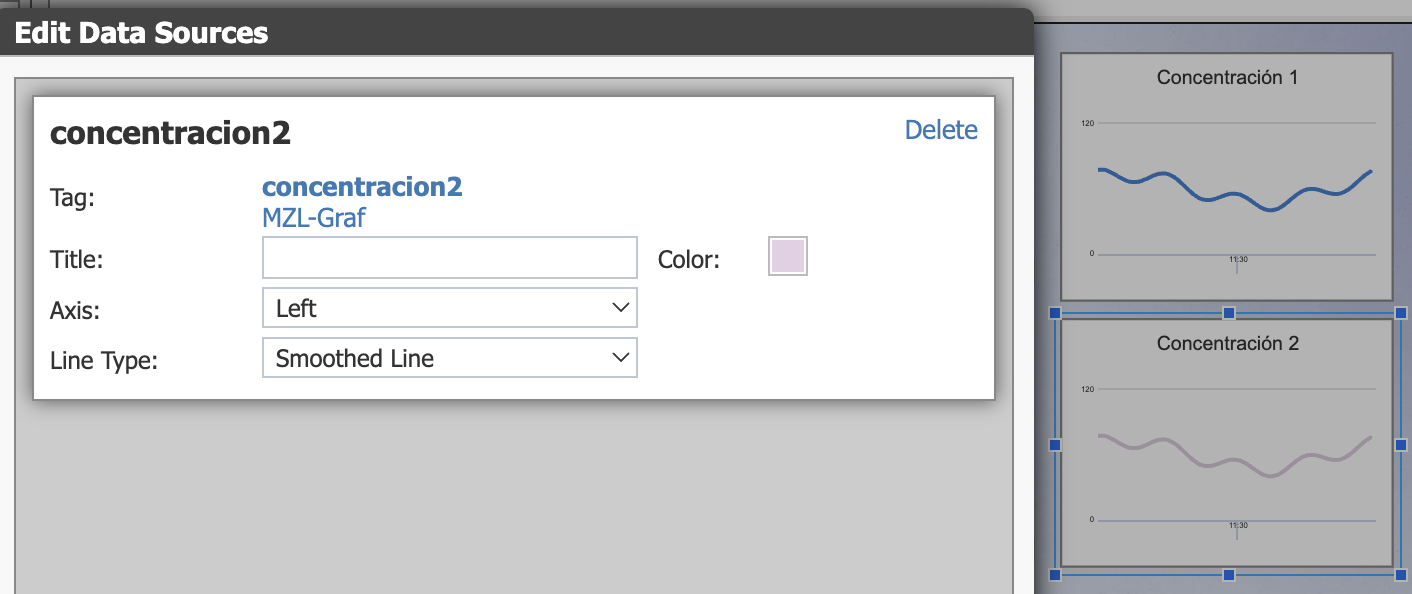
|7/6/2022 23:05:43|BackgroundScanningService|Missing a tag state for {:tagId 45, :index 0, :bit -1, :retain 20, :update 5, :interactive true}!|
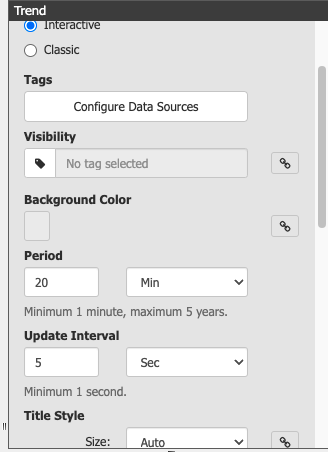
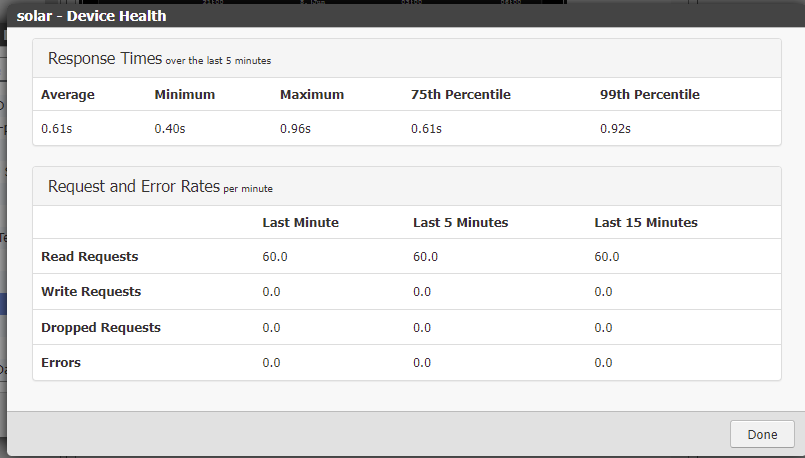
Can you please go into build mode and click on Configure → Devices and Tags.
From there, highlight the controller/device that the tag is coming from and take a look at the Device Health.
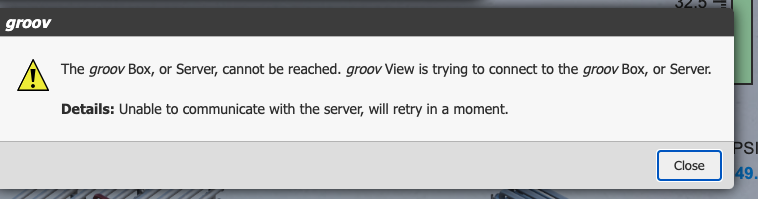
I’m wondering if you are seeing some network issues between the GS4W and the edge device.
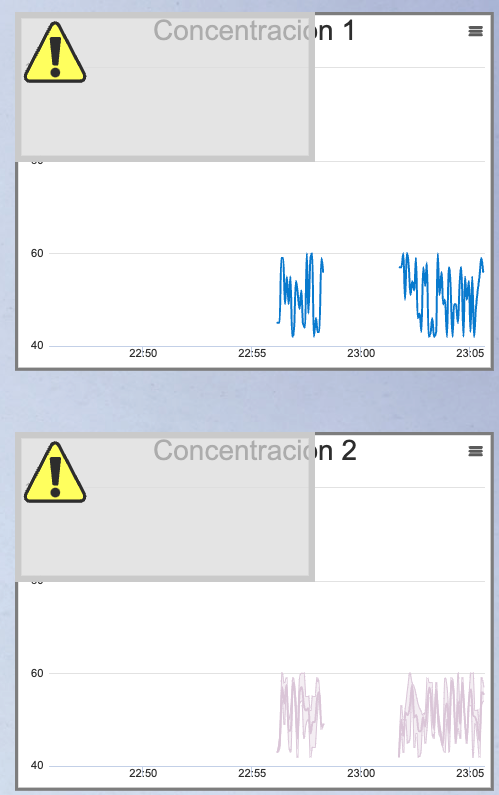
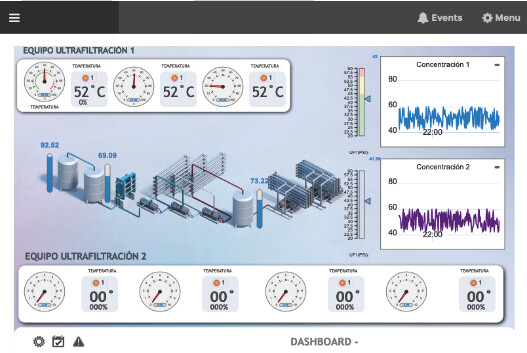
Here is example of one of my PAC R controllers that has a ton of trend data in my groov View.
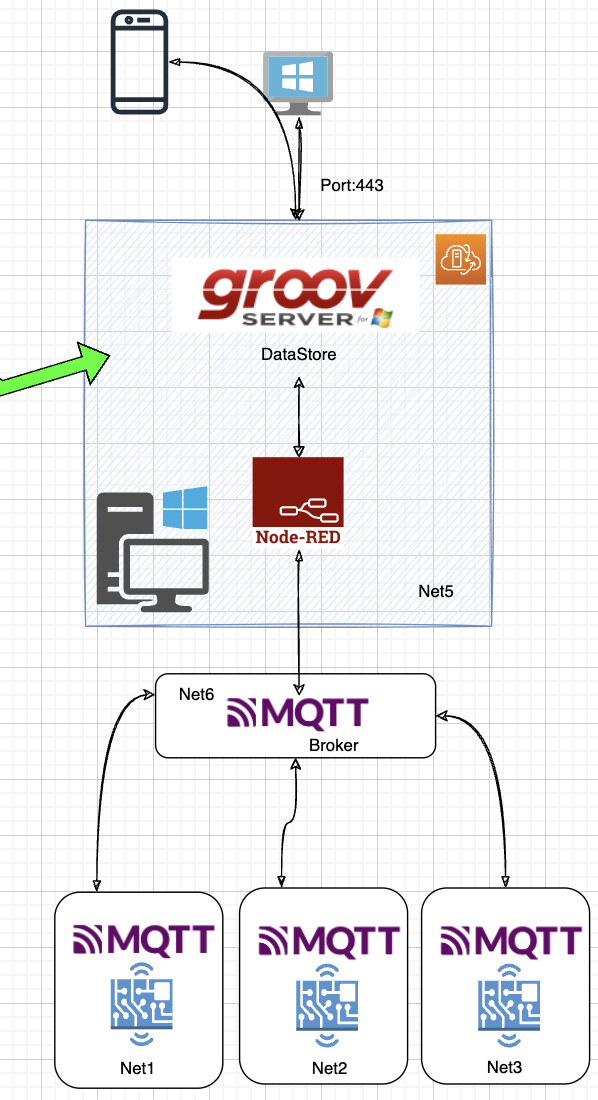
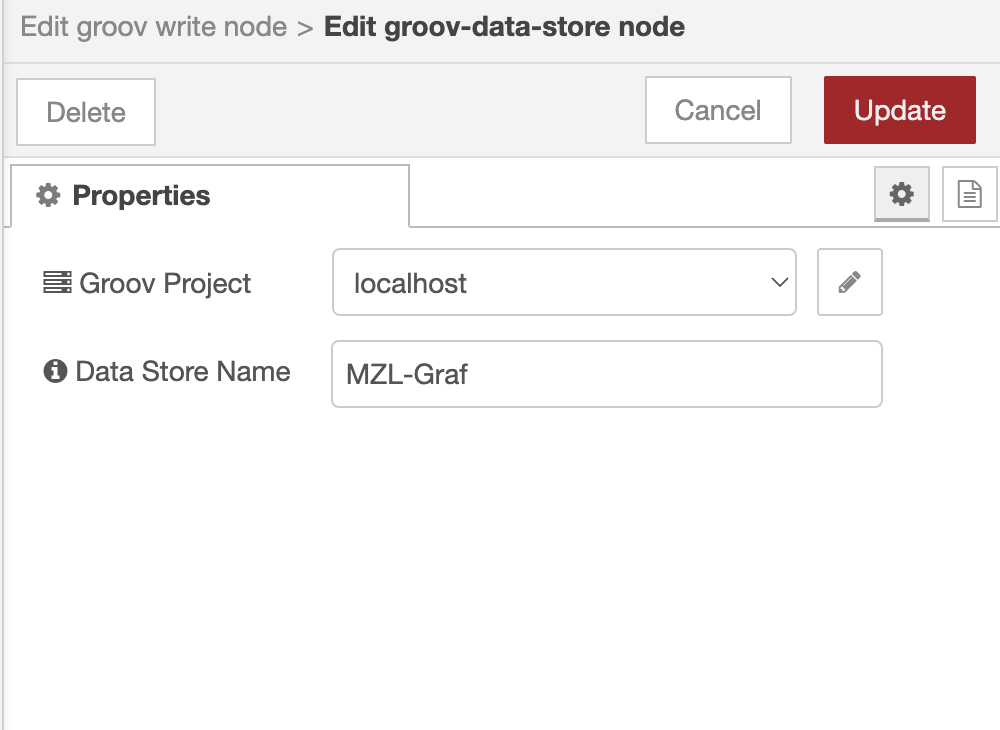
If I understand what he’s saying, he’s using Node-RED to populate a Data Store in groov View, and then trending that. There won’t be a device health thing to look at in that case.
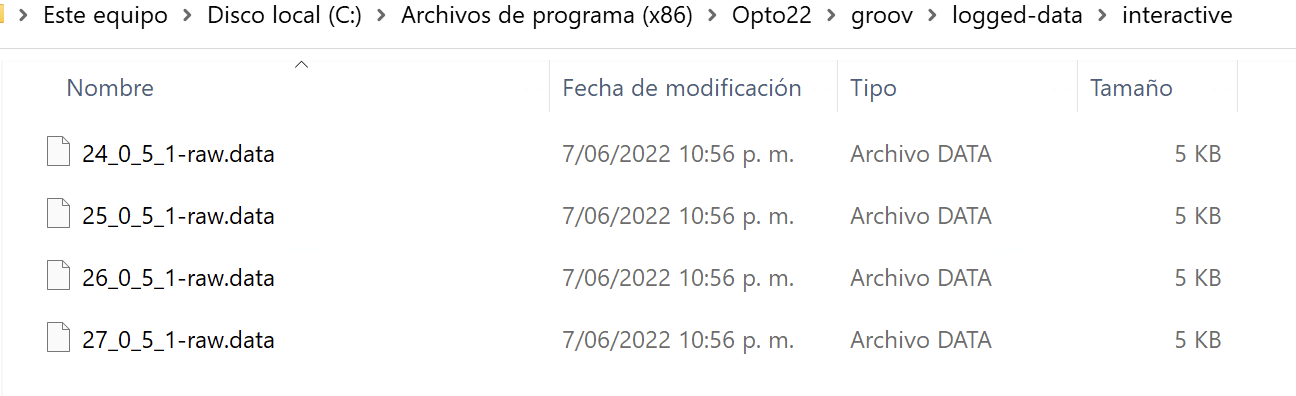
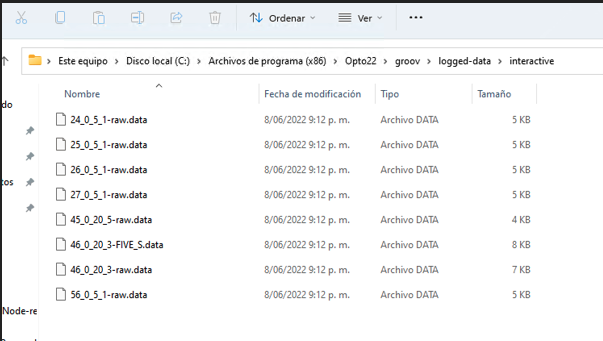
Take a look in C:\Program Files(x86)\Opto22\groov\logged-data: there should be two directories in there named classic and interactive, and the interactive one at least should have files in it. Is there anything in there?
I have identified the following behavior on the logged-data folder. When saving after making a change in the build mode the graphics restarts and the files in the folder are these:
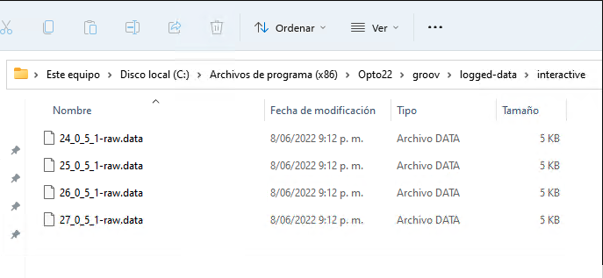
After the graph fails only the following files would be there, the other initial files are gone.
We’ll probably want to have you contact product support at this point. It’d help to get a look at your logs, and possibly your project to see what’s going on.
I have cleaned up all the pages that I am not using as well as the tags that I may have deleted. I have only left what I am actually using and I think that has solved the problem.