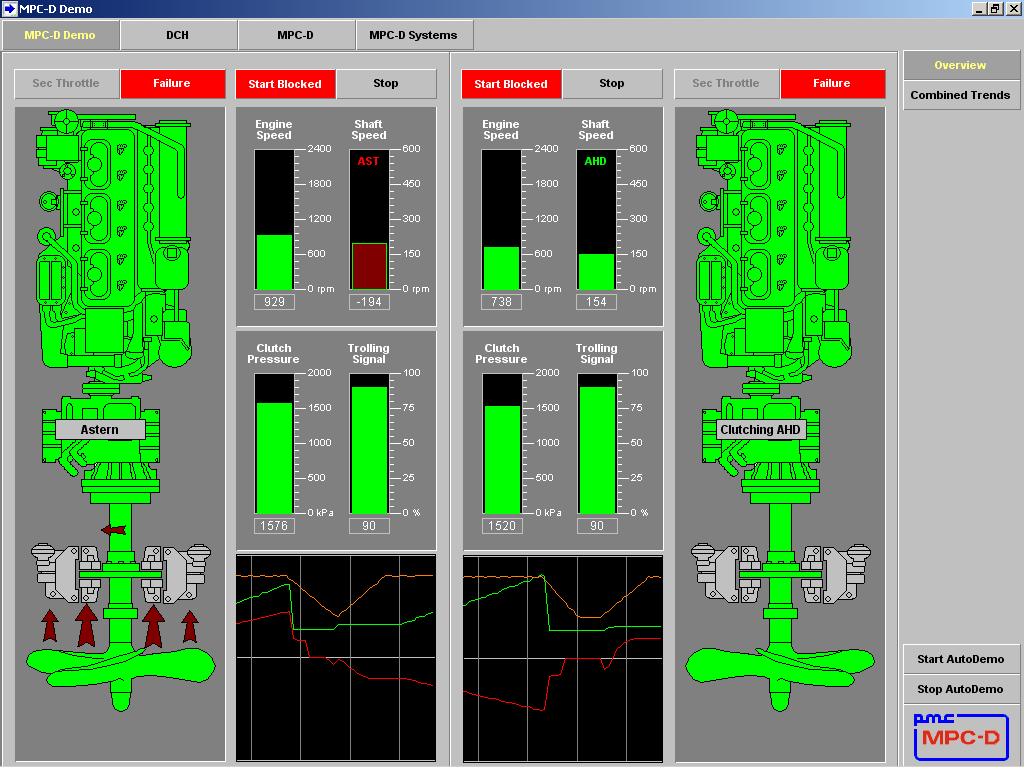
We have a small demo program from a number of years back that originally ran on an LCM4 with a couple B3000 serial brain I/O units. The programming was done in Factory Floor (OptoControl and OptoDisplay) and the system used a single Arcnet connection from the LCM4 controller to the Demo computer running OptoDisplay. In this demo project we have a couple 4 pen real time trend displays showing data from the controller using a 200ms refresh rate. These trends give a nice smooth representation of the data in real time.
We recently updated the hardware to a couple SNAP-PAC-R1s connecting via Ethernet to a newer computer. At the same time we migrated the project to PAC Project Pro (latest version). Once we got it all up and running the trend display on the new system was unacceptable: a very rough line with steps in it that honestly looked horrible. We tried the following things to see if we could get this back to the original system performance with no success:
Tried different refresh times: this made a difference but no setting came anywhere near close to the original.
Tried using a super trend with the same refresh time. This was surprisingly somewhat better but it was still a fine, stepped or quantized representation of the data.
Tried modifying / optimizing our PAC Control strategy using Optoscript and increasing / decreasing time delays in all loops, no change.
Finally just made a 2 script block test strategy to create four smooth ramped values. Still the same issue.
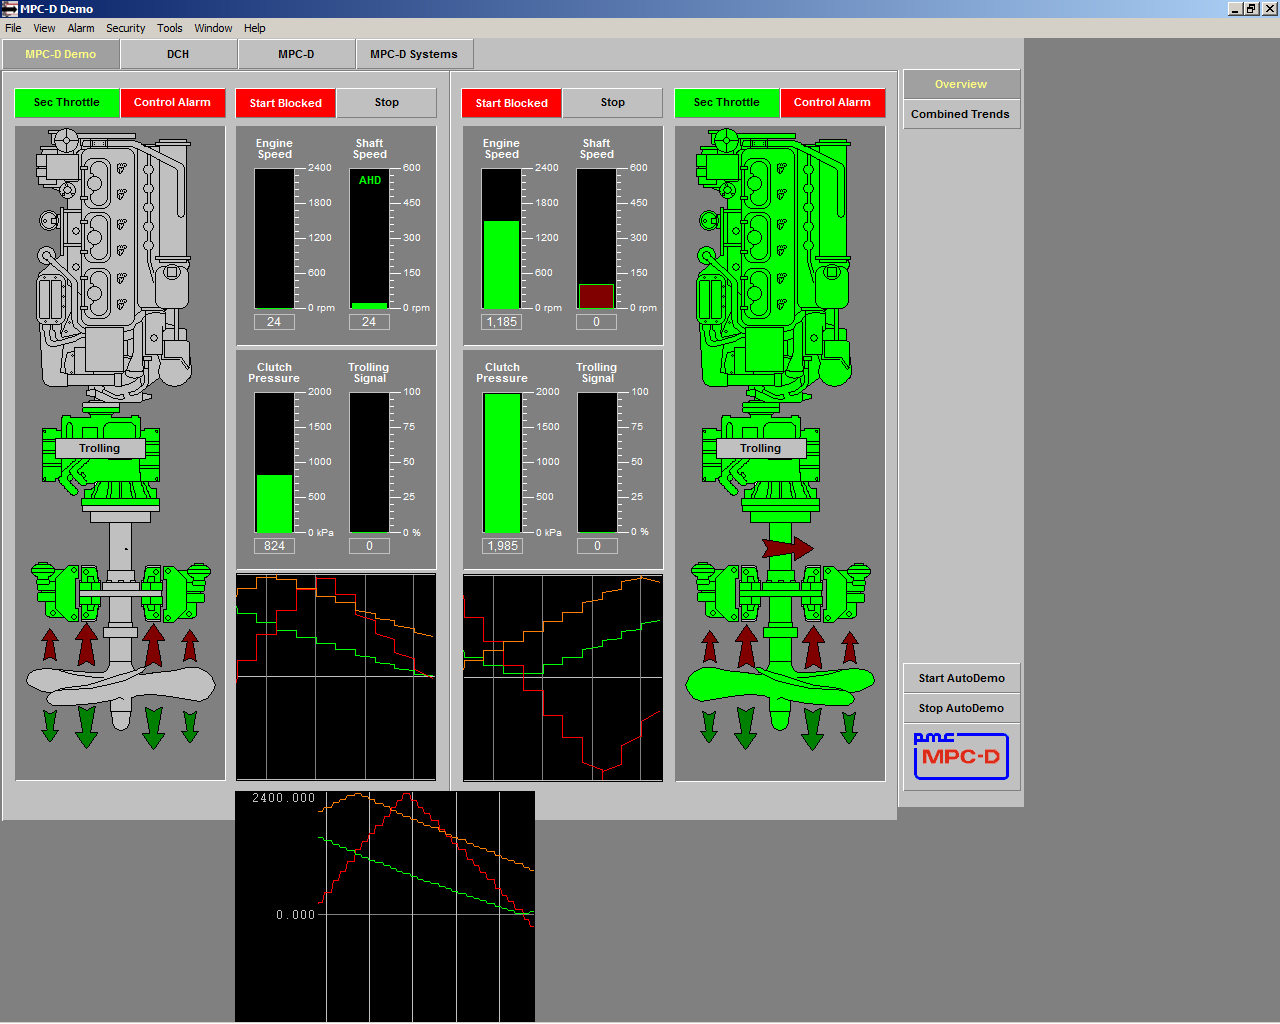
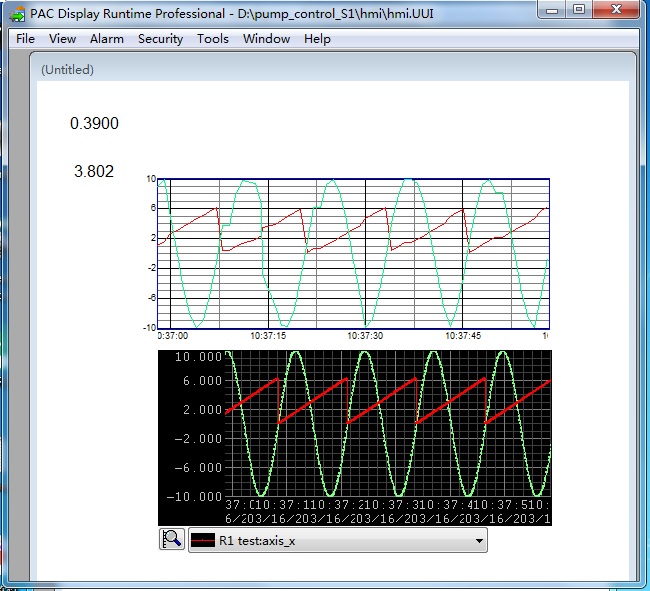
We have talked to Opto22 support and it appears that there is no solution for this. Before we give up completely, I was hoping that someone on these forums has had experience with running fast trends in real time on PAC Display and figured out a way to make it work. I’m uploading two screen grabs showing the differences in how these display:
I tried to replicate in a R2, 200ms, 10 seconds with both a float and analog input and I did not have the issue.
Now if this data is in a single table there may be the issue, several things to look at.
How many charts in total are you running?
I’ve had this issue in the past (with SuperTrends) and it seemed related to the Hard Drive access.
You mentioned newer PC - are you using a solid state drive, etc. ?
Do the trends run better on another PC?
Try increasing the Buffer number within the Trend (SuperTrends)
What are the update times for other variables and I/O ?
Do you have historical files being generated ? Large or small number of tags? Fast Update times?
With the normal trend there should be no Hard drive access and the test Supertrend I set up I just set to “realtime” (not historical or combined). I’ve tried this on both two different Windows 7 machines (at least one of which has a solid state drive) as well as a Windows 10 machine and saw no difference so it does not appear to be computer related. All other elements on the screen are set at a 1second update rate.
My super stripped down test strategy is now only running one chart with only a few small script blocks and appropriate delays in the program loop.
I’m going to strip things down even more so there is just the one screen with the trends (and no other graphics on it) and see what happens. Then I will try switching the pen variables over to individual floats instead of a float table to see if that makes any difference.
I’m filling / updating the float table in one of my script blocks. Basically right now I’m just incrementing or decrementing these 3 values on the table in my script blocks to create continuous up / down ramps for testing purposes.
I’ve stripped down the single HMI screen to just 3 Trends. There are now the two plain Trends which are still ugly as… and one Supertrend (realtime) which is now surprisingly perfect! (each of the plain trends is linked to a different -R1 controller, while the Supertrend is linked to the same -R1 as the plain Trend above it)
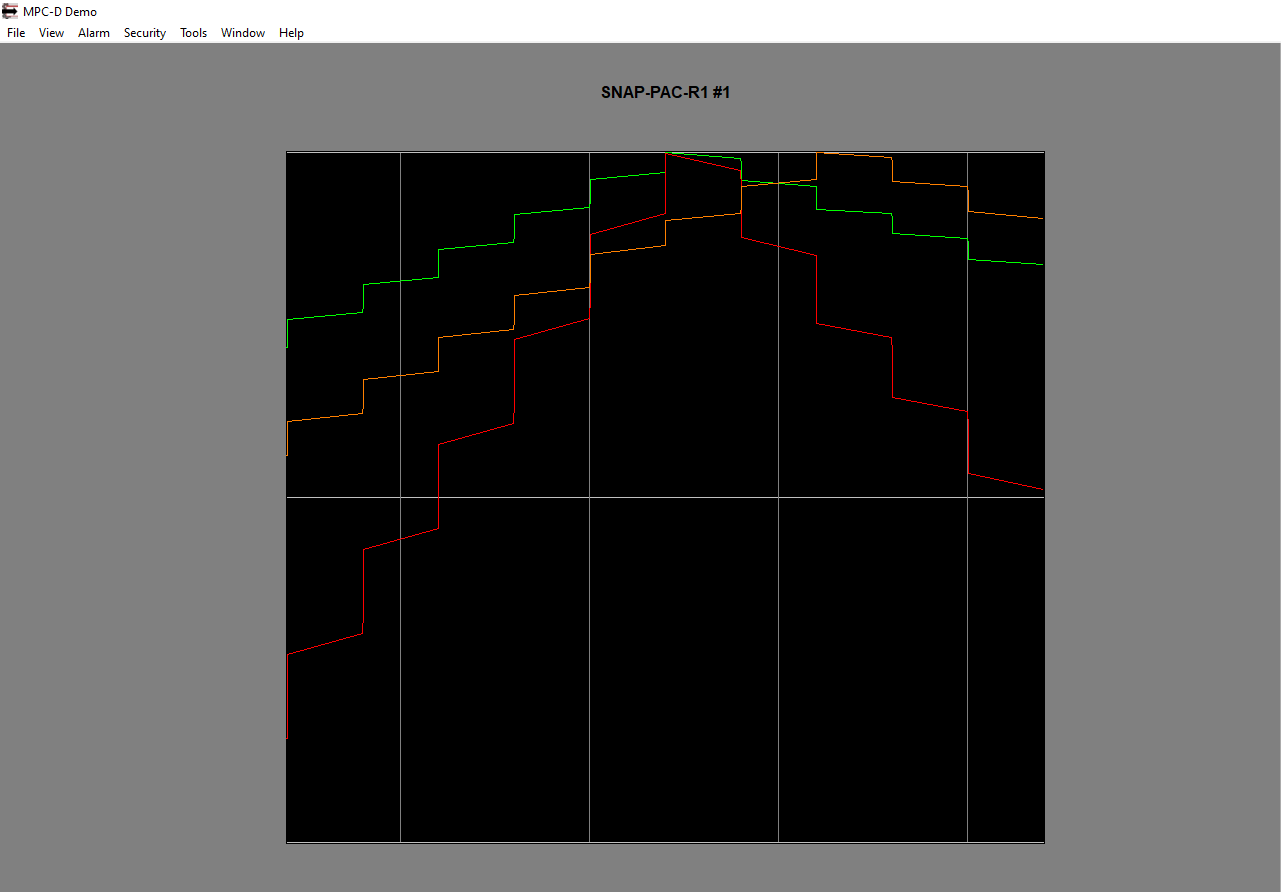
Well I’ve stripped this down to the simplest form with only one plain / normal 3 pen Trend (not a super trend) reading Float Variables from only one of the two -R1 controllers. I only have the one computer making this connection and PAC control is not running (or any other programs). I still have the problem though so I think I’m at a dead end (see picture below). I may have to see if I can get the supertrend to still run nicely once the other graphics are added back on the screen since it seemed to run okay by itself.
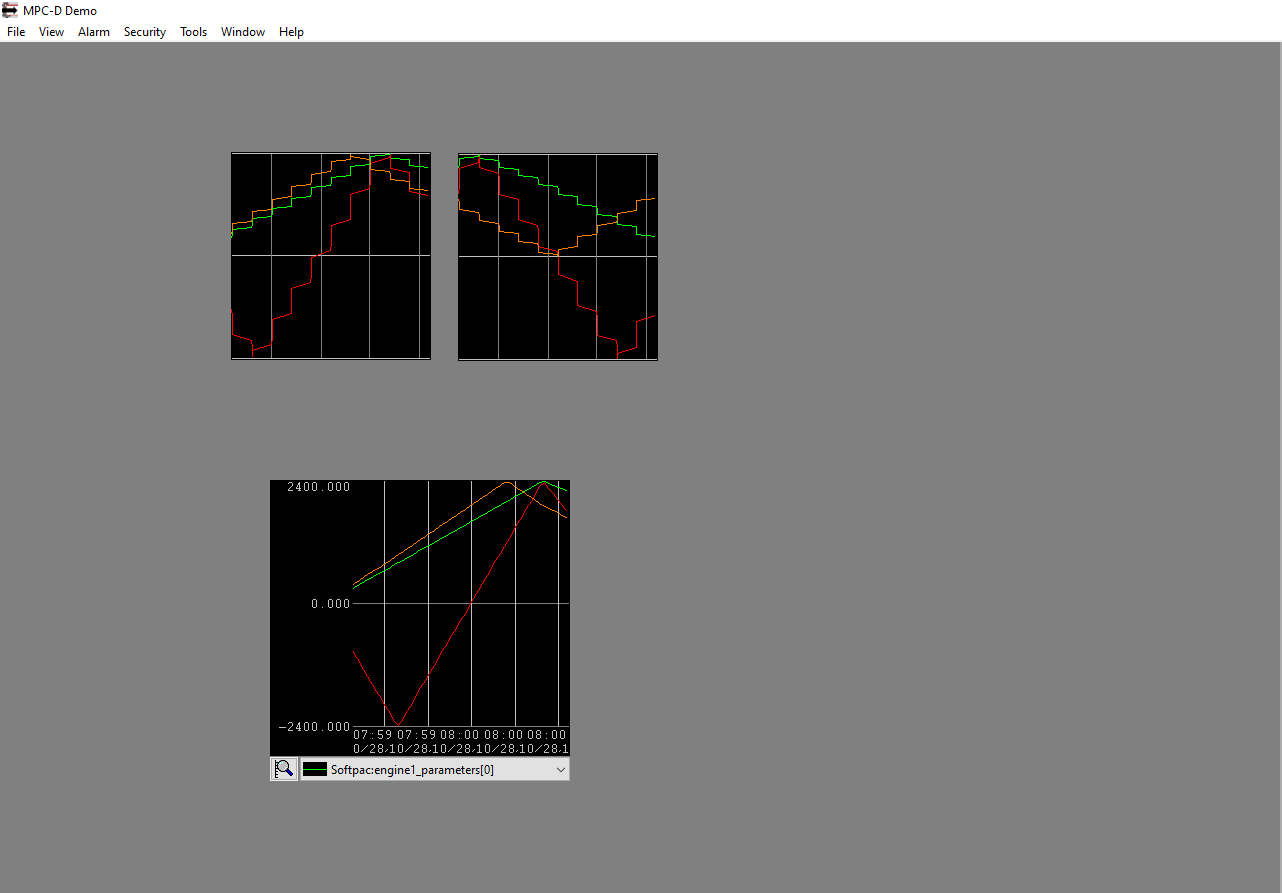
I have been following this thread and playing a little with PAC Display running a test strategy on SoftPAC.
I am a little lost in what the end goal is here… The trend is showing the exact data points from the strategy linked by a line. Its doing exactly what it should be doing?
If you want smaller steps/jumps in the graph, you need to ensure both your trend samples the data faster (more/closer together data plots) and the data does not change in amplitude as much between updates.
Over 10 seconds you are really limited in the number of points that can be plotted on the trend… I think that’s the bottom line.
EDIT 1 hour latter… Thinking about this some more… what I was trying (badly) to say was this;
The problem appears to be how often the HMI / PAC display is able to obtain and display fresh data (and perhaps also how it interpolates between data points). If you look at the last trend plot screen grab I posted, it appears that it is only getting 1 new data point each second (each y axis graduation is 2.5 seconds). It’s interesting that this interval appears to be almost exactly 1 second. It makes me wonder if I just have something set wrong but I’ve re-checked the refresh setting multiple times. I’m also not sure what accounts for the vertical jumps in the line. This is in spite of the fact that the refresh time is set to 200ms in PAC Display and the loop time for the extremely simple single chart strategy I’m using to produce these ramped values has a loop time of around 3 ms (including a 1ms delay in the loop). (Lots of oversampling there - my internal value is updated at least 300 or more times a second.)
Add that to the fact that this was not an issue on now nearly 20 year old Opto22 hardware and software based system and you have something that has me seriously scratching my head. I know Ethernet has a pile more overhead than the old Arcnet ever had but surely we can still process and display 3 float values every 200ms or less with linear interpolation between consecutive data points producing a smooth line?!?