Beno, can you tell me what the Ping utility MMP addresses are?
Yes I have created a flow that works, but doing it in Pac Control is way easier.
I have the ping sample, but of course it does not work on an Epic.
Actually, how about the addresses for the Test Port, Trace Route, and NS Lookup while you’re at it.
The MMP ping area was never an officially supported area, I’m not very surprised it does not work on EPIC (Linux vs Coldfire).
Any chance I could talk you into using Node-RED for ping? (Way easier than PAC Control - in regards to ping).
For the network stuff, its not in the API (at the moment), so again, its all there in Node-RED.
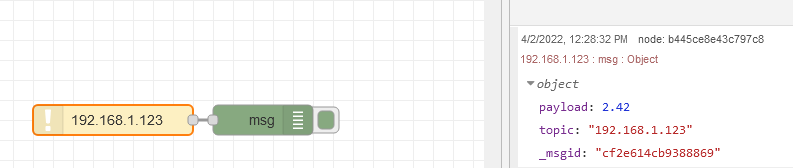
See this flow as a good start. (I know, its RIO, but it works the same in EPIC).
Let me know exactly what your looking to do / find and we can see what we can do if you are open to using Node-RED.
So I have been working on NR in parallel and after much security issues, finally figured out how to set the PEM path and so on. That wasn’t the only problem, had problems with the API key not being retained after restarting the flow. But seems like got all that working now, have a simple flow that uses pac read and pac write. Writes to an int in pac control to let me know that current ip string read into NR has been pinged, then output is the float value to pac control which can be evaluated for > 0ms or < 120ms.
This should work ok. I have more than one IP to ping, but although I noticed that the ping-node will accept a string table input, the result is that it pings each one separately, so then I would have to figure out how to separate the responses to evaluate each result for each IP. Figured it would be way easier (if the req is only 3 IPs) to just make 3 flows with separate read and write vars.
Everything works like a champ, I have 4 IPs which are read one at a time directly from the string table. These are all in series with each separate ping-node and then a pac write writes directly to each separate element of a float table. Then at the end in parallel with the debug node I have a pac write writing to a trigger flag in pac control. The chart in pac control waits for the trigger, then hits a while loop to determine what the pass fail is based on 0=fail, >0 to <120ms=good or 1, and over 120ms fail=0. Then based on each result another ntable to hold number of failures for each IP.
How do I peel the timestamp off of Ping-Node so I can send the string to pac control?
I have a NR/Pac Control that works on Epic perfect and does the following:
This chart will provide up to 4 IPs pinged every minute and returns the ping interval to a table and then increments a count if the value is 0ms or above 120ms. When the count set point is reached, does a reboot of 2 relays for 5 seconds on then off (using the NC contacts) for power to a modem and or wifi radio.
The count is limited to x number of reboots a day and the reboot counts are reset each day (not included in chart). You could make this every hour, day or multiple days if desired. Just clear the contents of Ping_RebootCnt_nTable once a
Day or as desired.
I exported the NR flow to text inside the chart. PingForEpic.zip (5.2 KB)
Thanks for the link, I started to watch but had to keep going, will get it watched as it is an excellent video, great job by Terry.