RTD Intro:
Resistance Temperature Detector or RTD is a passive sensor that changes its resistance by a known and repeatable amount over time.
Since its a passive device, an external device (in our case a RIO) is used to pass a small electrical current through the RTD and the resulting voltage change can be converted to resistance and then to temperature using one of the code samples further down this post.
RTDs have a known temperature coefficient, one of the most common is 0.00391 Ohms per deg C.
*You will see that number in the code samples further down this post, if your RTD has a different coefficient, change this number to match.
RTDs come in one of three different lead configurations.
Two wire - the temperature sensor is simply connected across the two leads. This is often used where accuracy is not critical.
Three wire - the temperature sensor is connected across two of the leads and the third lead is connected at the probe end to one of the two sensor wires. With this configuration the total round trip resistance of one of the sensor leads can now be detected by the measuring instrument (if supported) and the resistance of the total lead length of one of the sensor wires (and assuming the second second sensor wire is the same length/resistance) can be compensated for resulting in a more accurate measurement.
Four wire - the temperature sensor is connected across two of the leads and the third and forth wire are connected at the probe ends to each of the sensor wires. With this configuration the resistance of both sensor wires can be be measured and compensated for - but again, only if the measurement instrument supports 4 wire RTD devices.
RTD on RIO
The groov RIO does not have a specific input type of “RTD”. However, there is a way to measure and convert the resistance to temperature data with an RTD PT100 using just a groov RIO and a little math.
The process consists of configuring the sensor as a two wire resistance input, and taking the Ohms value shown from the sensor reading and converting it using PAC Control, CODESYS, Node-RED, or SSH to get a temperature reading.
Note that any loss of accuracy by using the RTD in two wire mode will need to be considered for your application.
Configuring the I/O Channel in groov Manage:
- Wire the RTD as a thermistor. If you have a three or four wire sensor, just use the two wires that are connected directly to the sensor.
- Open groov Manage and select the channel that the sensor is wired to.
- Click on configure and use the resistance input type “0-400k Ohms Analog Input” (shown below).
- Don’t worry about scaling as that will be done in the software.
- Give the point a name. Note: if you are using PAC Control the name will be overwritten by the name you use in the strategy after you do a download, so keep that in mind.
- Click save after you are done setting up the point.
![]()
Converting the Sensor Reading from Resistance to Temperature (degrees C or F):
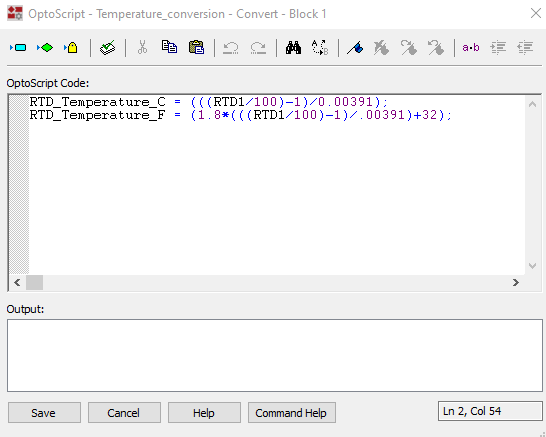
PAC Control
- Configure the I/O channel(s) from your RIO that you would like to measure.
- Define a numeric float variable for the RTD temperature to be displayed (degrees C or F)
- When creating a chart to do this conversion, include an OptoScript block and use the code shown below. On the left side of the equation write the name of the variable defined earlier and choose the correct equation for either Celsius or Fahrenheit.
Node-RED
(This uses ScratchPad float index 1 for °C and index 2 for °F)
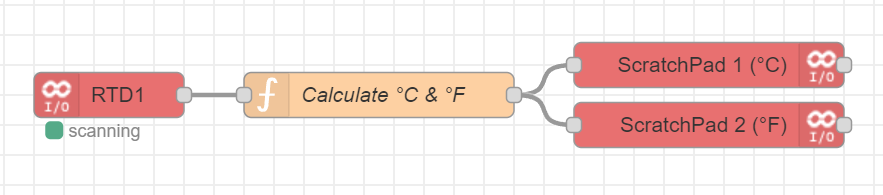
[{"id":"2be3322fd48c4b6a","type":"function","z":"eb891162369b57fb","name":"Calculate °C & °F","func":"var coef = 0.00391;\nvar RTD1 = msg.payload;\n\nmsg.tempC = ((RTD1 / 100) - 1) / coef;\nmsg.tempF = 1.8 * (((RTD1 / 100) - 1) / coef) + 32;\n\nreturn msg;","outputs":1,"noerr":0,"initialize":"","finalize":"","libs":[],"x":290,"y":100,"wires":[["0c57813c89a3da96","8abbfa9a6fe64aa5"]]},{"id":"856f1381d553562c","type":"groov-io-input","z":"eb891162369b57fb","device":"931f146ae03bee95","dataType":"channel-analog","moduleIndex":"0","channelIndex":"2","mmpAddress":"0xF0D81000","mmpType":"int32","mmpLength":"1","mmpEncoding":"ascii","sendInitialValue":true,"deadband":"1","scanTimeSec":"1.0","name":"RTD1","x":110,"y":100,"wires":[["2be3322fd48c4b6a"]]},{"id":"0c57813c89a3da96","type":"groov-io-write","z":"eb891162369b57fb","device":"931f146ae03bee95","dataType":"mmp-address","moduleIndex":"","channelIndex":"","mmpAddress":"0xF0D82004","mmpType":"float","mmpLength":"1","mmpEncoding":"ascii","value":"tempC","valueType":"msg","name":"ScratchPad 1 (°C)","x":510,"y":80,"wires":[[ ]]},{"id":"8abbfa9a6fe64aa5","type":"groov-io-write","z":"eb891162369b57fb","device":"931f146ae03bee95","dataType":"mmp-address","moduleIndex":"","channelIndex":"","mmpAddress":"0xF0D82008","mmpType":"float","mmpLength":"1","mmpEncoding":"ascii","value":"tempF","valueType":"msg","name":"ScratchPad 2 (°F)","x":510,"y":120,"wires":[[]]},{"id":"931f146ae03bee95","type":"groov-io-device","address":"localhost","msgQueueFullBehavior":"DROP_OLD"}]
- Install the package
node-red-contrib-groov-io. - Import the flow above.
- Add your device and admin-level API key.
- Make sure the module and channel are set for your RTD resistance.
- Deploy the flow and see calculated temperatures in the ScratchPad float area.
SSH (Python)
(This uses ScratchPad float index one for °C and index two for °F. Also, set index zero to 1 to stop the program from looping.)
import time
import optommp
mod = 0
chn = 2
dev = optommp.O22MMP()
flag = dev.GetScratchPadFloatArea(0)
while(flag != 1):
RTD1 = dev.GetAnalogPointValue(mod, chn)
tempC = ((RTD1 / 100) - 1) / 0.00391
tempF = 1.8 * (((RTD1 / 100) - 1) / 0.00391) + 32
dev.SetScratchPadFloatArea(1, tempC)
dev.SetScratchPadFloatArea(2, tempF)
time.sleep(2)
flag = dev.GetScratchPadFloatArea(0)
dev.close()
- Use pip to install the
optommpmodule. - Create or upload a *.py file with the above code.
- Make sure the module and channel are set for your RTD resistance.
- Make sure the ScratchPad float area index zero is set to anything but
1. - Run the script and see calculated temperatures in the ScratchPad float area.
- To stop the script from looping, set index zero to equal
1.
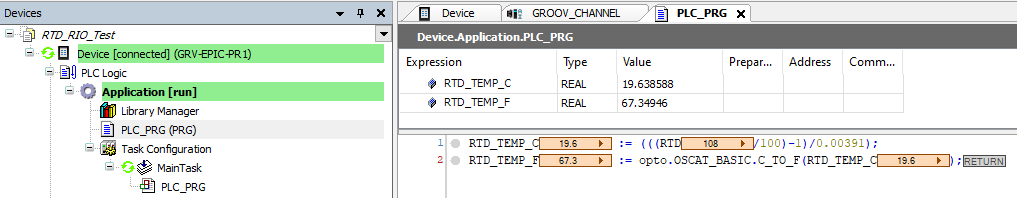
CODESYS
- Configure one channel of a RIO to the 0-400K RTD input.
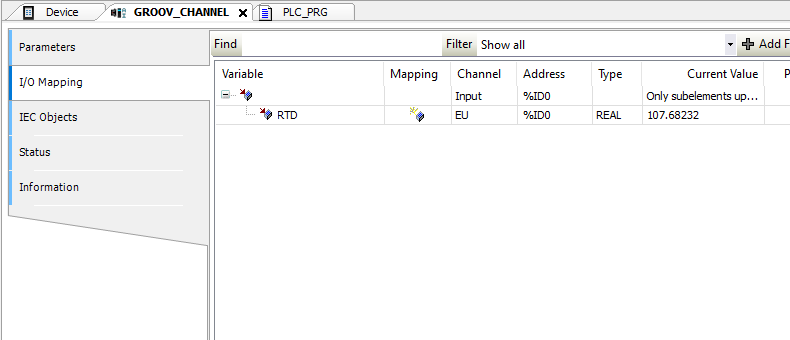
- Use the same OptoScript code shown in the PAC Control section with the built in temperature conversion.
RTD vs ICTD
Here is an example graph showing how the RTD temperature tracked alongside Opto22’s ICTD temperature sensor. Both were connected to the same RIO with the RTD configured as above and the ICTD configured as per the user’s guide.

We moved both sensors between vessels of cold and hot water to give a little swing to the temperature range.
Of course the RTD is rated for a much wider temperature range than the ICTD, but this graph should give a confidence boost to the accuracy of the probe connected to the RIO while measuring resistance with the conversion occurring in PAC Control OptoScript.
The natural resistance curve of the RTD flattens out at the top and bottom of its range, and there is no ‘curve’ option in the RIO when in resistance mode, so you need to keep these factors in mind when deciding if using the RIO in this mode with your RTD will supply your required accuracy.