Node Red pac-read PAC error 0. Failed to connect to controller

Working with a Node Red project that was working. Went to check on it and found errors with Node Red communicating to the PR1.

image

The log file suggests to confirm the controller is running.

Here is PAC Control showing the strategy is running.

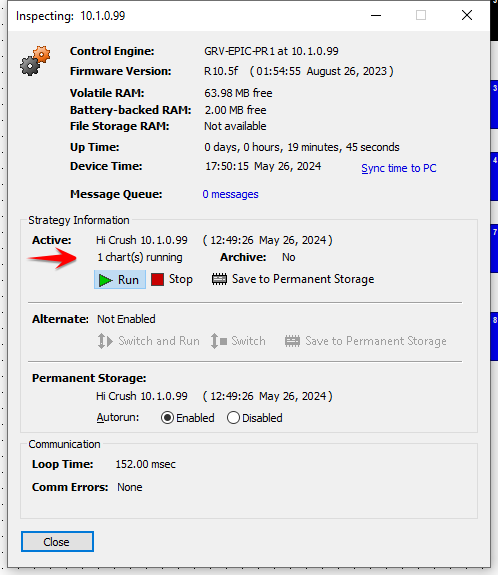
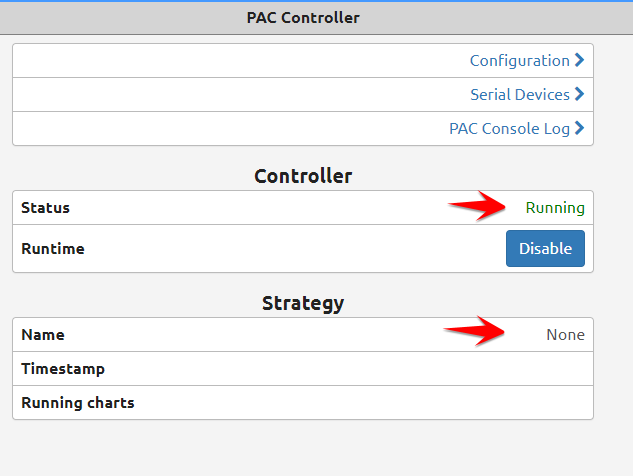
The groovManage interface shows the status as running…but does not have any information about the strategy. (I have seen this on other PR1s…I deleted cookies on my browser…did not fix)

image

Here is info on the PR1.

Here is what I have tried.

  1. Restarted node red project.
  2. Deleted, recreated and reinstalled SSL Certificate.
  3. Changed pac-device node address to localhost.
  4. Changed pac-device node address type from HTTPS to HTTP.
  5. Restarted controller.
  6. Cleared controller RAM
  7. Downloaded a different strategy to the controller.
  8. Removed pac-device node and added new one.

Other info:

  1. the PR1 has a MariaDB configured. It is accessible.

image

I don’t see ‘updating groov Manage API key’ on the list… I think that is the most likely issue.
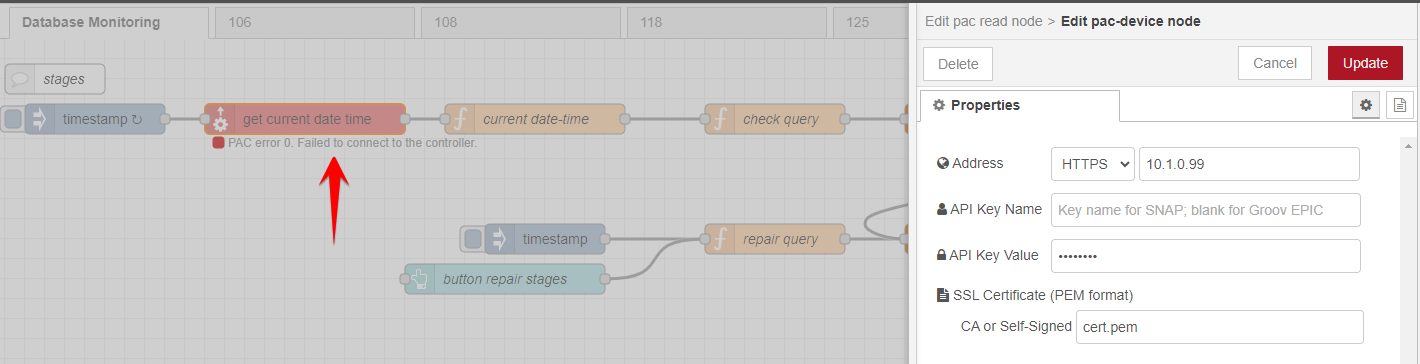
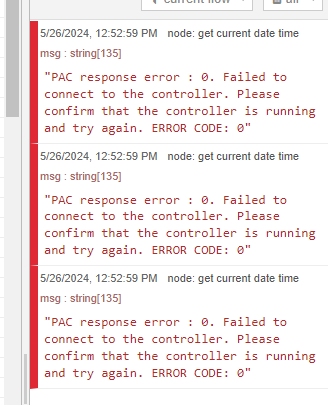
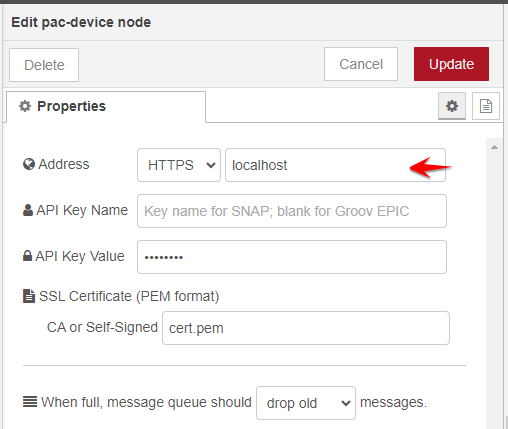
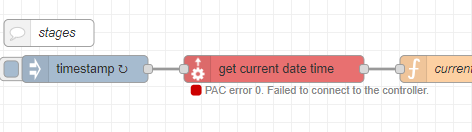
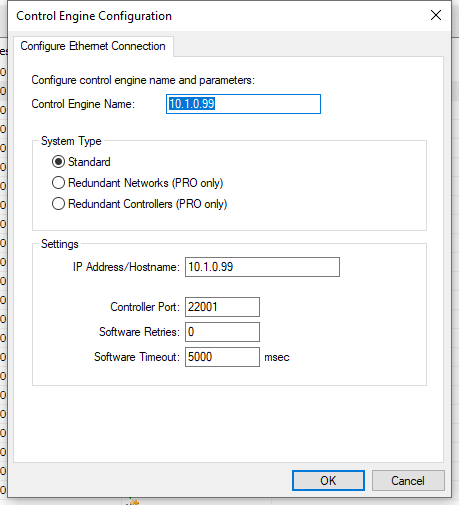
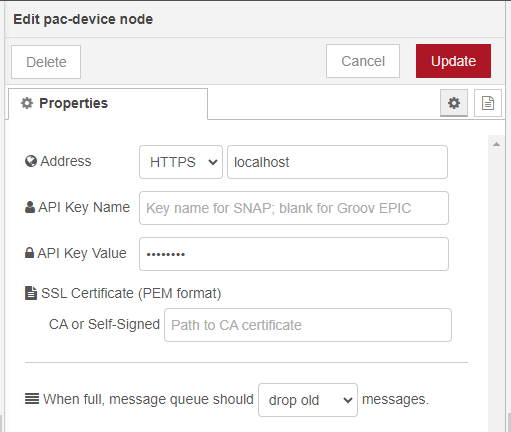
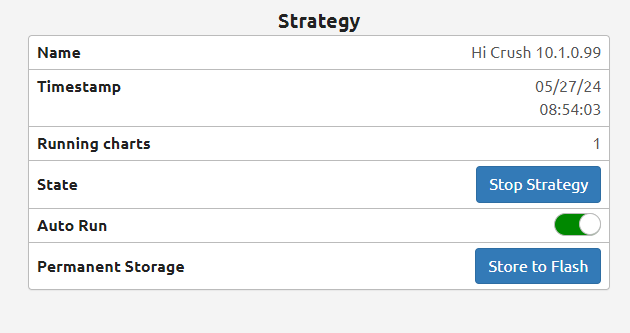
Node-RED can’t access the controller, so it is either the 10.1.0.99 IP address (it should be localhost for EPIC controllers) or the API key has changed.

Also the fact that PAC Terminal shows a strategy and the EPIC control engine does not sort of points me to that your PAC Term is looking at some other controller?
I have not seen the ‘no strategy’ issue for about 4-5 years (it’s an old bug, and since you are running 3.5.1, there is something else going on).

EDIT: Also, for localhost, a cert should not be in use. I would clear that out of Node-RED as well.

I changed the address to localhost and generated a new API key…plugged it in. Same result.

image

image

Here is the PAC Term config.

Here is the network config.

I cleared the cert.pem. Same result.

image

Is the API key of a user that has permissions to the PAC Control REST API?

Something is wrong with the strategy, because it is not shown in groov Manage. Perhaps try a new download, or restatrt the EPIC controller.

I assume that the data you want to access from the strategy is made public in PAC Control.

I found the PAC REST API host port had been changed to alternative host port 28500 in the /usr/share/nxtio/services/pac-bridge/settings.yaml file…something that we have been doing to balance the load on all of our integrations.

The PAC Control strategy did not have logic to start the alternative host port.

 stat_Start_Alternate_Host_Task_28500 = StartAlternateHostTask("tcp:28500");

Not sure if it is related but the strategy information is properly shown in groovManage after the code addition and download.

image

Thank you for all your help…sorry for my lapse in memory.

3 Likes

That would have taken us a good deal of back and forth to track down the changed port number…
Thanks for letting us know the conclusion.

Yes, that’s related: groov Manage uses the PAC REST API to look up information about the running strategy.

1 Like