We had a customer question / request come in as follows;
We have several RIOs in the field, remotely monitoring a system for us. They are each on their own cellular router. The data usage on the routers is too high for what we are doing.
We are running a Node-Red application, and I assume it may be a high possibility that something is reaching out to the web in the background.
We are just trying to figure out what is doing it. Is there a way to monitor the traffic on the RIO to watch the upstream and downstream traffic?
So with that, here are some thoughts and a ‘starter’ flow to start chipping away at this.
Its a great question and as we see more edge devices deployed on things like cellular (and soon networks like Elon’s SpaceX Starlink) we are going to need a way to keep costs and traffic in check and monitored.
In regard to Node-RED phoning home in the background, I have never seen that, or heard of it.
That said, there are so many (~2500) nodes, who knows what combinations a given user has installed or is using in some way… So it can’t be ruled out.
The other thing that comes to mind is how to monitor use without increasing use?
That one I don’t have a clean answer to. If you send the data use count via MQTT it would be pretty lightweight, but it will still add to the count. If you look at it locally via a Node-RED dashboard, when you look at that dash with a browser, you will add to the count. If you use groov View, it will add to the count.
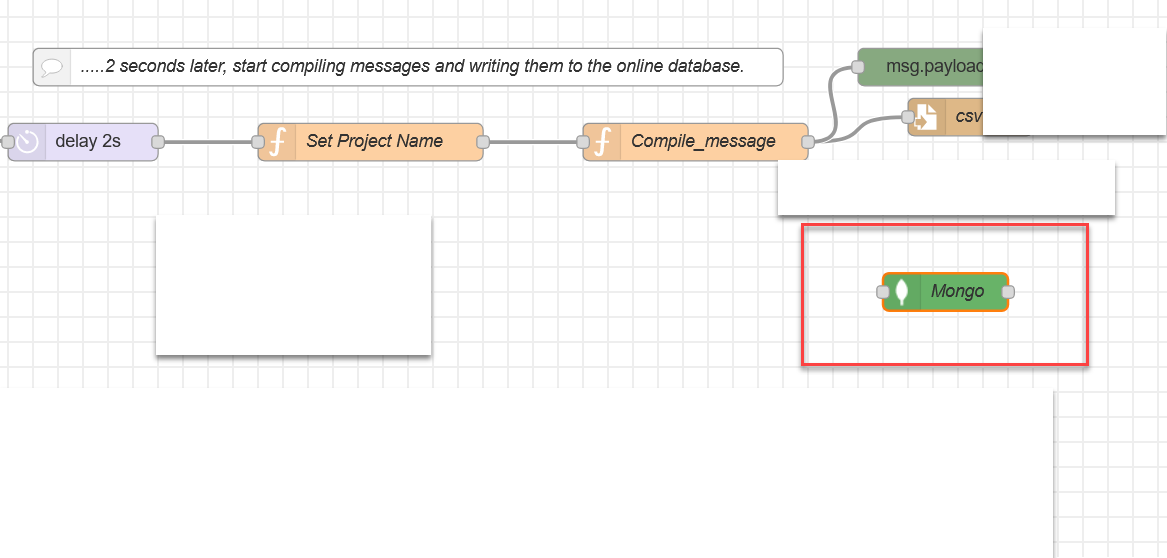
With that said, here is an example flow to start looking at the data and hopefully start a conversation in this thread about how to address this customers core question.
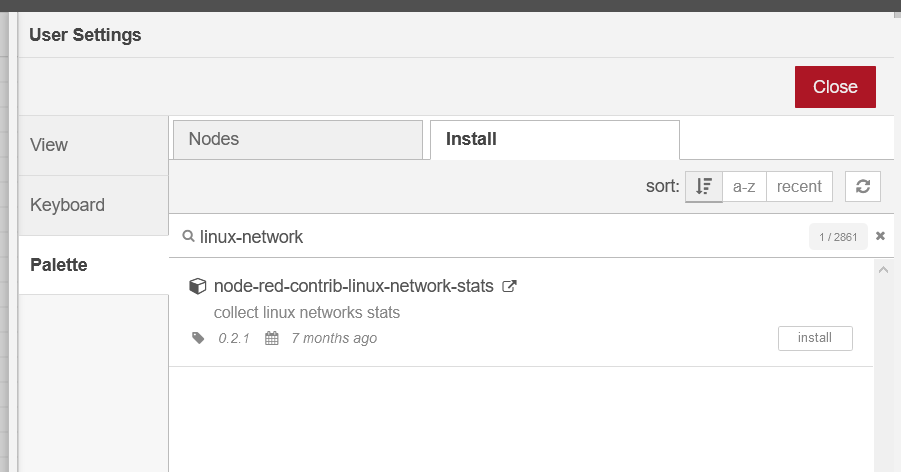
First up, you need to install the Linux network monitoring node.
Open the menu and click on Manage Pallet, then click on the Install tab and search for the node-red-contrib-linux-network-stats (node) - Node-RED node.
Once you have that node installed, the example flow I put together is very simple.
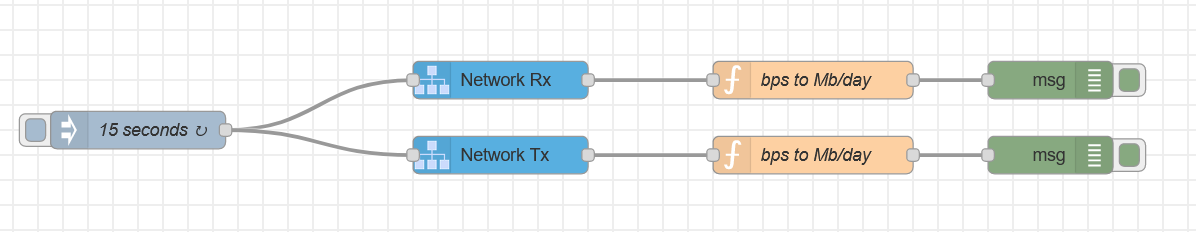
I simply chose the 15 seconds inject time at random. Its a pretty course time sample, but it is easily adjusted for your use.
We read the Tx and Rx data from the Linux OS and then convert the returned bytes per second to something a little more human, megabytes per day. In the same function block we also keep the original rate by moving it into its own message payload.
The debug then shows both the daily and the per second data payloads.
Here is the flow;
[{"id":"c92db70a.f0d04","type":"network_stats","z":"baf6cc39.6fbd2","name":"Network Rx","receivedBytesSec":true,"transmittedBytesSec":false,"x":430,"y":140,"wires":[["acecfe87.6b0208"]]},{"id":"a0b3aed4.1a77c","type":"inject","z":"baf6cc39.6fbd2","name":"15 seconds","props":[{"p":"payload"},{"p":"topic","vt":"str"}],"repeat":"15","crontab":"","once":false,"onceDelay":0.1,"topic":"","payload":"","payloadType":"date","x":140,"y":180,"wires":[["c92db70a.f0d04","c5b5f223.3bbc18"]]},{"id":"253bdc30.e44954","type":"debug","z":"baf6cc39.6fbd2","name":"","active":true,"tosidebar":true,"console":false,"tostatus":false,"complete":"true","targetType":"full","statusVal":"","statusType":"auto","x":870,"y":140,"wires":[]},{"id":"c5b5f223.3bbc18","type":"network_stats","z":"baf6cc39.6fbd2","name":"Network Tx","receivedBytesSec":false,"transmittedBytesSec":true,"x":430,"y":200,"wires":[["e6fb9750.e4e3e"]]},{"id":"acecfe87.6b0208","type":"function","z":"baf6cc39.6fbd2","name":"bps to Mb/day","func":"// move the orignal message into its own payload\nmsg.rxbps = msg.payload;\n\n// covert the slightly unfriendly bps to mb per day\nmsg.payload = msg.payload / 11.574;\n// reduce to 1 decimal place\nmsg.payload = Math.round(msg.payload*10)/10;\nreturn msg;","outputs":1,"noerr":0,"initialize":"","finalize":"","x":680,"y":140,"wires":[["253bdc30.e44954"]]},{"id":"e6fb9750.e4e3e","type":"function","z":"baf6cc39.6fbd2","name":"bps to Mb/day","func":"// move the orignal message into its own payload\nmsg.txbps = msg.payload;\n\n// covert the slightly unfriendly bps to mb per day\nmsg.payload = msg.payload / 11.574;\n// reduce to 1 decimal place\nmsg.payload = Math.round(msg.payload*10)/10;\nreturn msg;","outputs":1,"noerr":0,"initialize":"","finalize":"","x":680,"y":200,"wires":[["d4e0045a.4638f"]]},{"id":"d4e0045a.4638f","type":"debug","z":"baf6cc39.6fbd2","name":"","active":true,"tosidebar":true,"console":false,"tostatus":false,"complete":"true","targetType":"full","statusVal":"","statusType":"auto","x":870,"y":200,"wires":[]}]