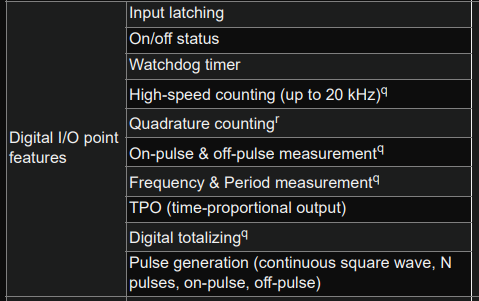
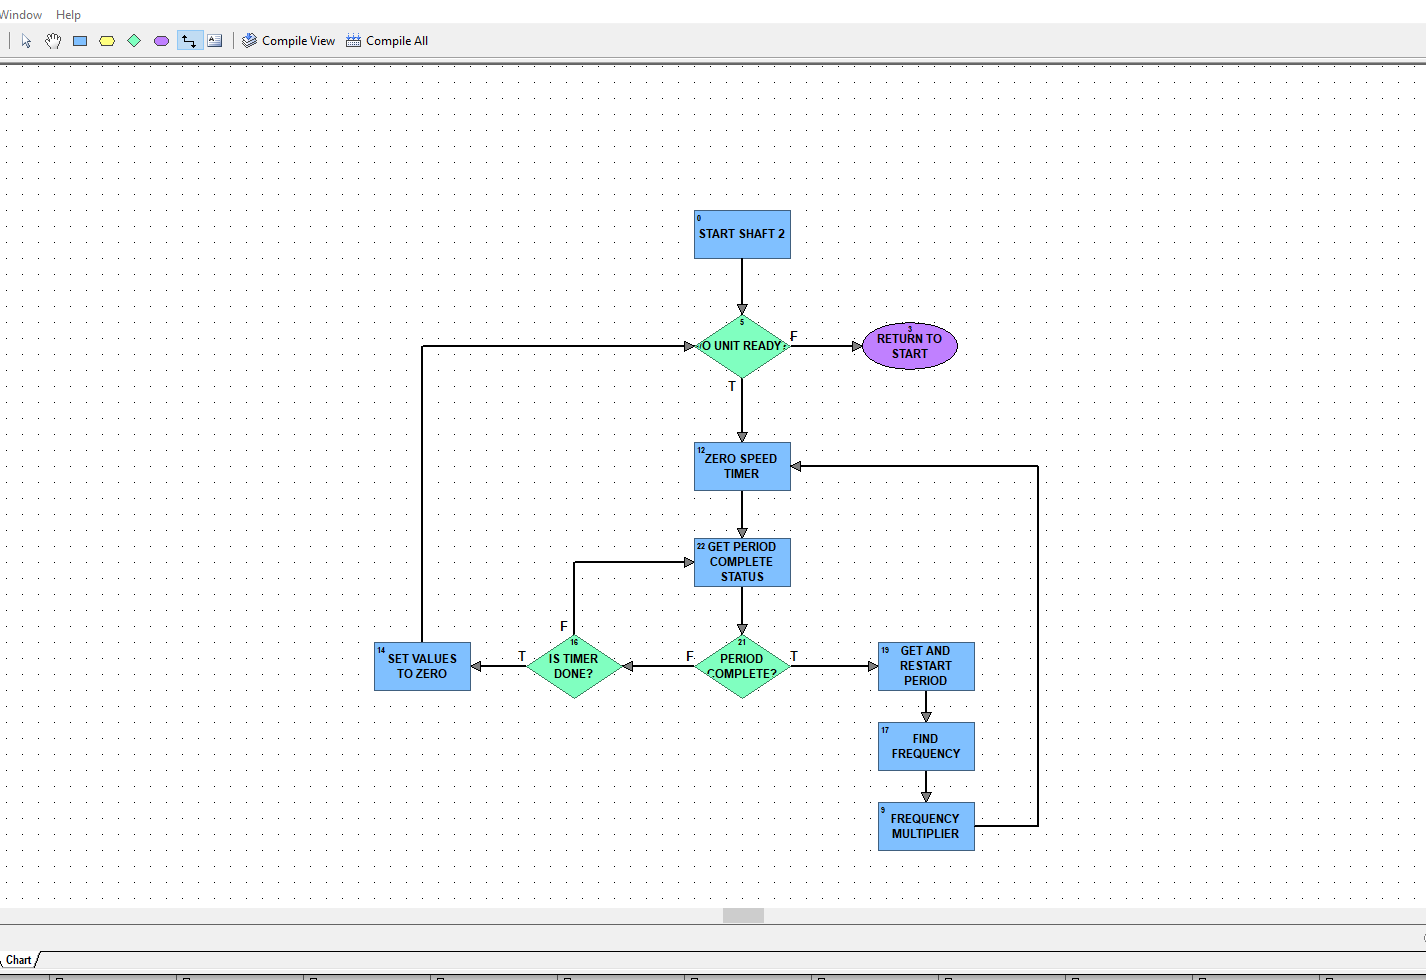
I’m using Pac Control Basic (Version R10.5b) to “try” to create a project to read the speeds of up to 64 shafts. I found some great information on form 1784 "RPM Measurement Techniques. Due to the slow speeds of most of the shafts I’m reading I chose to use the Period Measurement Method, and used the example chart as a guide. This works very well for one shaft but I haven’t found a way to build it out for all of the required shafts without exceeding the maximum of 16 charts available on the Snap Pac R1 that I am using.
I am a novice on Pac Control, this is my first real experience with flow-chart style of programming. I would appreciate any help on this please.
Your best bet is probably to abstract the actual logic into a subroutine and pass the required data for each shaft to the subroutine. This would allow you to ensure the logic is consistent for each shaft while also requiring a single chart.
Option 2: Use Pointers
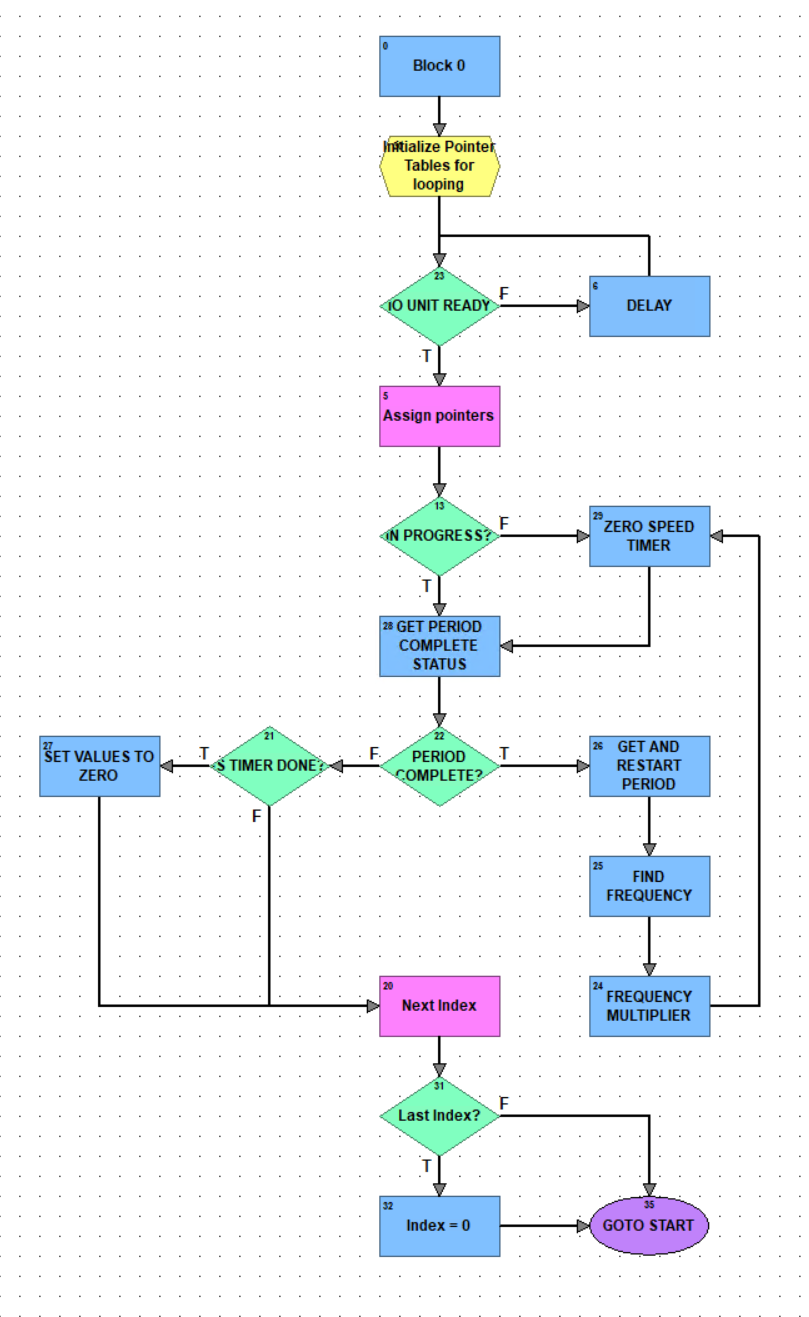
If you don’t want to use a subroutine, you could also have a single chart that assigns pointer variables for each shaft using a loop and then runs the main logic against the pointer variables:
Block 0 (Action Block)
initialize index to 0
Block 1 (OptoScript Block)
if exceeded max index, set index back to 0
switch statement with entry for each shaft for assigning pointers or convert index to string and use GetPointerFromName command to set pointers for current shaft.
As many blocks as you need for shaft logic
Block to increment index then loop back to Block 1.
Option 3: Separate Charts
You could also create a chart for each chart and either have each chart call the next one (creating a loop) or have a separate management chart that calls each chart in order (using CallChart instead of StartChart).
The 16 chart limit refers to charts running simultaneously on a SNAP PAC R1, so as long as you chain the charts together rather than having them all running simultaneously, you’ll be fine. In this case, however, I could probably recommend a single chart using one of the two methods mentioned above.
I’d be interested in using the brain side of the controller a bit more… What can you offload to the module and brain and just have the chart read the data as needed.
Perhaps even an event reaction might work here.
64 is a lot, but they sound slow, so the chart methods @varland mentioned is worth considering as well.
Just keep in mind there is about a 100msec ‘delay’ as you start one chart and stop the preceding chart, so having 1 chart logic in a loop of 64 charts will have a pretty solid delay between shaft 22 being read each cycle.
Pointers and a table of 64 timers is a solid option if your coding skills are at the pointer level (mine are not for example so tend to shy away from them - @torchard on the other hand, loves them!).
Can you share what SNAP modules you are using? I’m wondering what the shaft sensor is outputting.
The R1 is the controller with the built in counting/smart features vs the SNAP-R2 which does not have any of those, so lets see if you can use them to do the heavy lift…
I prefer the pointer method (my background is in software engineering), but I would initialize a pointer table with all the digital inputs prior to the loop instead of using a switch statement:
ptRotation[0] = &diRotation1;
ptRotation[1] = &diRotation2;
etc.
Then in a for loop get all your measurements:
for nLoopIndex = 0 to 63 step 1
  pRotation = ptRotation[nLoopIndex];
  //Perform point logic here using *pRotation instead of the digital point directly. It’s helpful to assign the result to a float table so you can take advantage of the loop index and not need another pointer table for all your result variables.
  if(GetPeriodMeasurementCompleteStatus(*pRotation)) then
    ftRotationPeriods[nLoopIndex] = GetRestartPeriod(*pRotation);
  endif
next

DelayMsec(50);
Use the time saved from writing dozens of charts to learn more about pointer programming and you will have more skills in the tool bag for the future.
Edit: Cleaned up formatting and added some additional logic.
I think you can just set to Frequency & Period on each point and you are about done?
Your chart does not have do the counting or calculating, just read each shaft as the process requires.
I guess it depends on what control you are needing to do and what sort of update rate the process requires.
Beno’s idea is good, but when the period measurement is selected in the point configuration, it will be set to Channel Feature 0x0B which is one-time period measurement.
For continuous period measurement to be enabled, a 0x03 will need written to the Channel Feature in the digital point configuration - this can’t be configured in the IO unit config in PAC Control, but can be set in PAC Manager or can be written to using the PAC Control MMP commands.
Note this will only work on PAC, not supported on groov I/O.
I am using the Period measurement. I am using Pac Control Basic and I don’t see an option for the combo Frequency & Period. I previously was using the Frequency method but most of the shafts are too slow. The only math I am doing is dividing 1 by the Period to find the frequency, then I multiply it for increased resolution before sending the date out through UDP. My communication is working perfectly, which I thought was going to be more challenging than the rest of the program. Shows what I know.
To enable continuous period measurement that Beno is thinking about, try this:
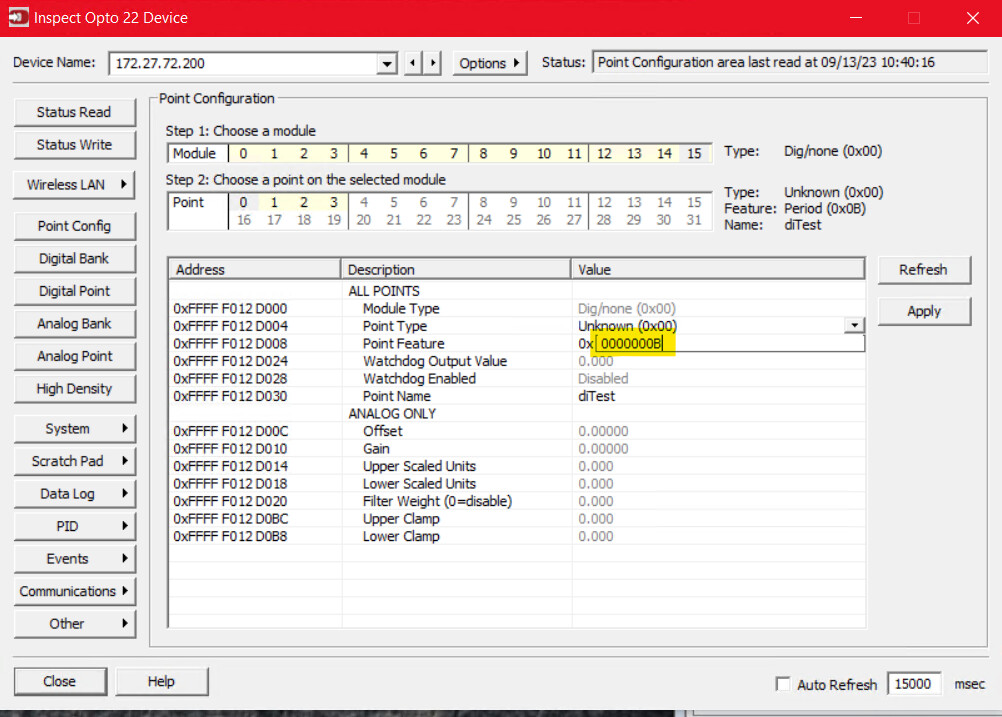
In PAC Manager - go to Tools | Inspect. Put in the IP address of your R1. Click on Point Config button and select one of your digital inputs that you are not doing anything with in PAC Control yet.
Change the ‘Point Feature’ from 0x0000000B to 0x00000003 and click Apply:
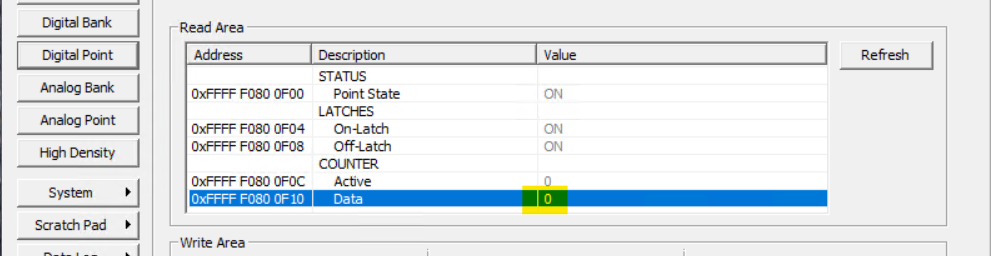
Then press the Digital Point button and make sure the same digital input is selected. Press Refresh as much as needed and see if the “Data” value changes under the “COUNTER” section while the Digital Input is toggled.
If that works, then you should be able to just call “Get Period” on each point in PAC Control and won’t need any other logic. There are some other steps to get this configuration to stick around in the IO unit, but first test if it works at all.
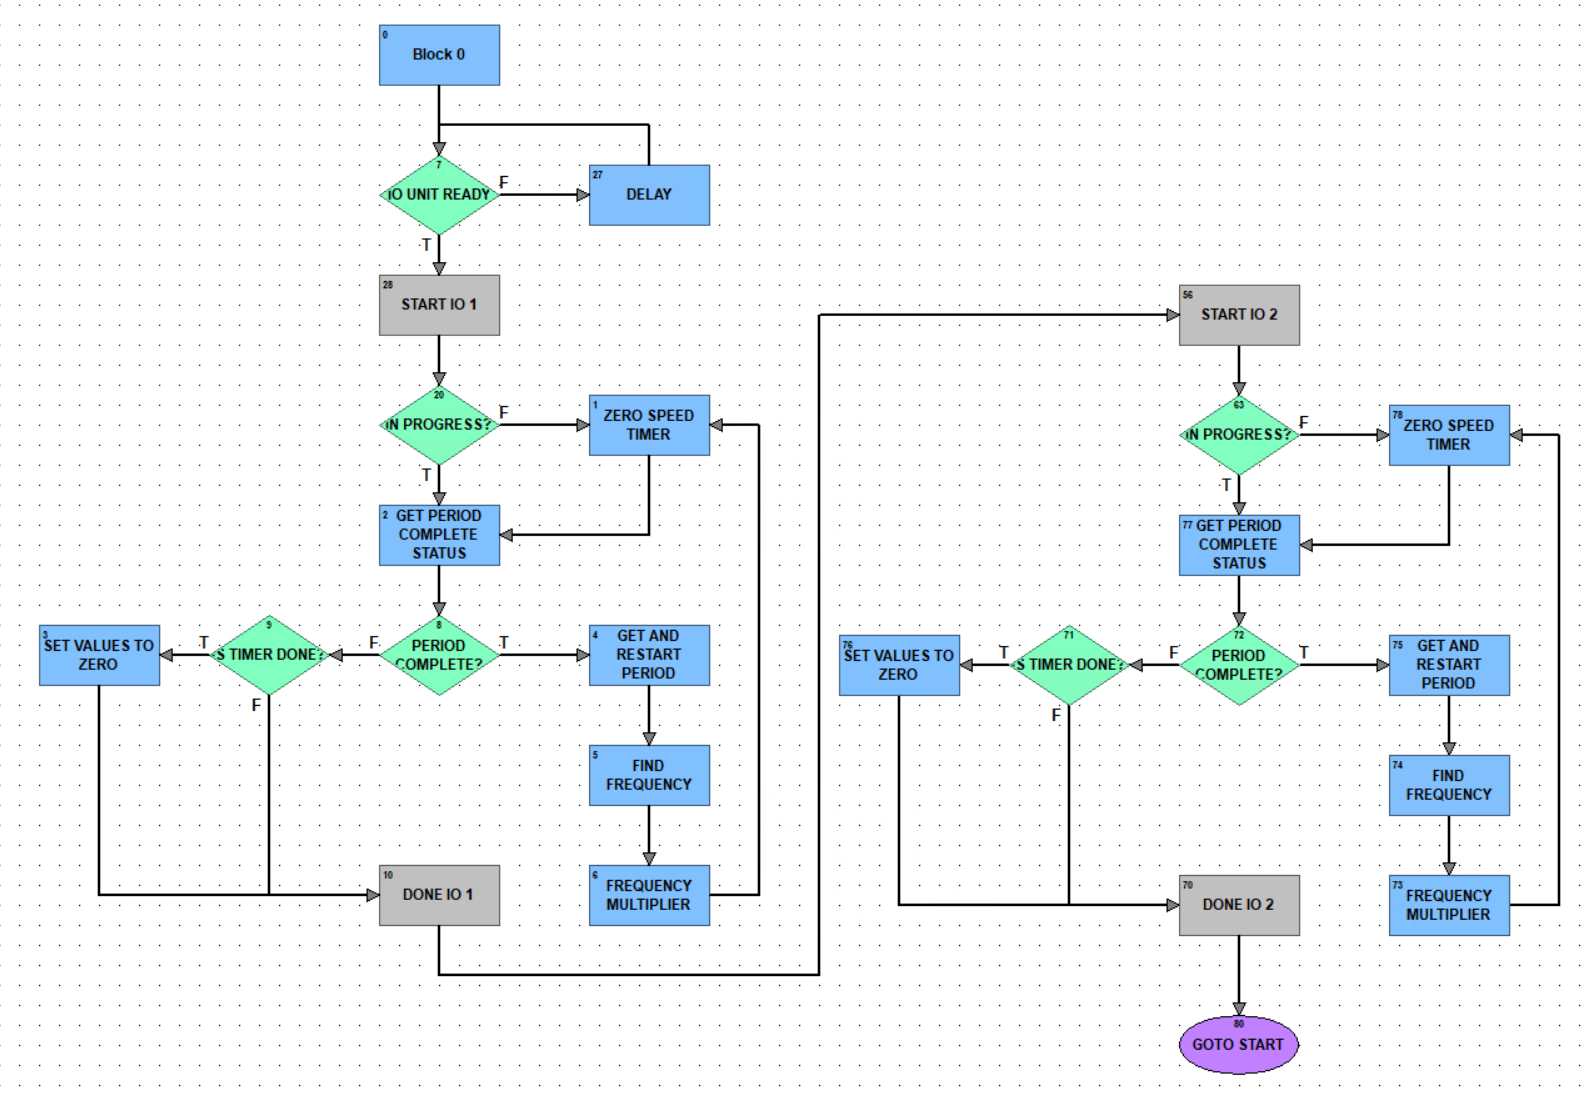
I am able to get the period measurement working continually. The problem I am running into is that I am using the Period Complete is true to trigger the measurement to be converted to the frequency and transmitted. If the Period Complete is not true, the flowchart loops back to try again until a down timer expires, which writes a zero to the pertinent variables. This is how I am showing “zero speed”. Otherwise the most recent value after a Period Complete true is held. Individually, this is working well. I am trying to build it out to 64 points without exceeding 16 running charts. I have tried calling the next chart by each chart but the execution time is way too long that way.
My gut feeling is that the solution won’t be overly complicated, but being a Pac Control novice I am unfamiliar with setting up subroutines or pointers and my scripting skills leave a lot to be desired. My background is more in ladder and function block.
Yes, the 1 Hz resolution didn’t work. I didn’t have the needed resolution with the integer either. With the Period Measurement I have a real number that works much better
This would represent two measurements, but can chain more. I added a check for “in progress” which you will need to create a flag for so the next time it runs through it doesn’t reset your timer prematurely.