Hello,
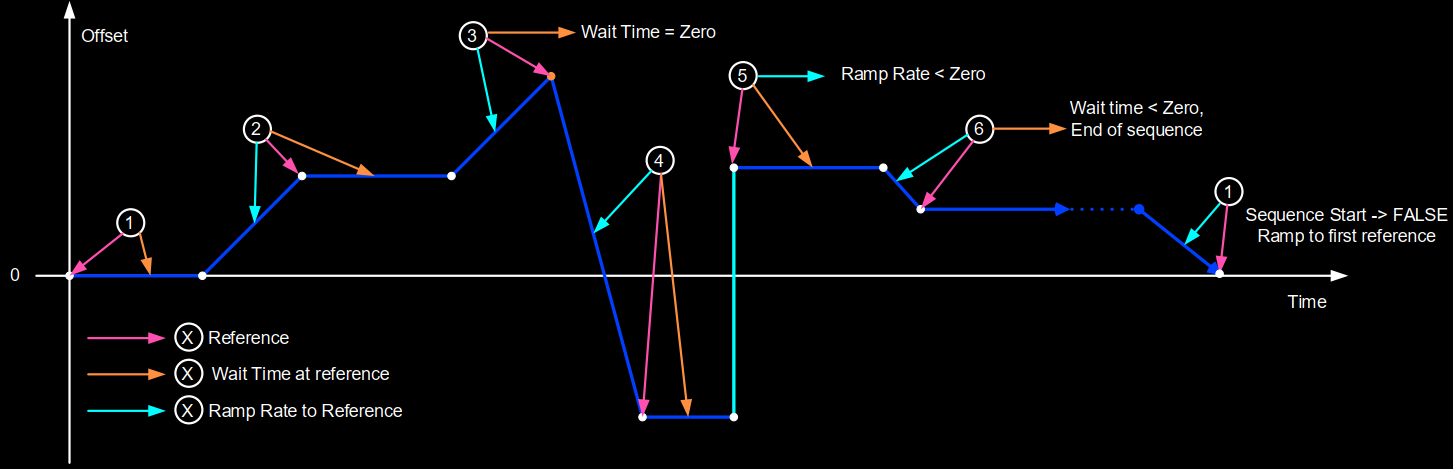
I’m building an automation system that controls set of inverters that can be programmed with frequency and voltage profiles. The profiles are 22 points long with ramp rates and waiting times at each point etc. as parameters that are set by the user in groov View and then written to the inverter via Modbus/TCP. Also if certain parameter is set to <0 the profile execution is terminated at that point.
Everything technically works but is there any way in groov View to create a interactive/dynamic graph that would represent the profile as the user parameters at the moment would define it? I mean I can copy-paste the visualization of the parameters from the manual to the page and let the user to figure it out (see below), but it would be infinitely clearer for the user if he sees from the groov View directly how the inverter will behave with certain set of parameters…
Thanks in advance!
-TimoA