Gudday Charliel48,
First up, welcome to the forum.
Getting to your question… I have to say, its very very very very very very very unusual to start a program (chart) from PAC Display.
Usually charts run all the time, and then you simply interact with them via PAC Display… In fact, to my knowledge, you interact with a single chart via PAC Display, but rather the entire strategy (which may consist of one or more charts)… This seems to fit in with the first part of your post where you talk about the ‘program’ rather than a chart (which, using the program term) is simply part of the program.
So, getting to the answer then… As far as I know, you cant do it directly… You are going to have to use a little smoke and mirrors.
Here is the big picture of what we are going to do… Set a variable in the chart which when set true runs the core program. Have the last part of the core program reset the variable when its done.
In PAC Display, link to that variable.
Here is a screen shot of the chart;
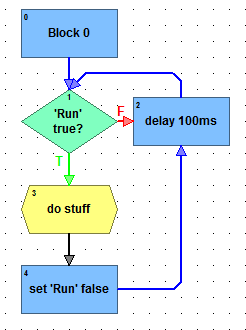
So, in the block 0, you dont do anything (as should be the standard practice (another topic for a different thread)).
In block one, ask ‘is variable’ true?
You should always have delays in your charts. Never ever, EVER loop around asking a question with no delay!!!
Once the variable is true (Note, its set true from PAC Display), you ‘enter’ your existing chart and do all that it says.
Once your chart has finished, add in the last block. In this block, use the command ‘Set variable false’ to set ‘Run’ false.
This way, after the delay, you will loop around asking if its true… which it wont be until you click the button in PAC Display and thus set it true.
The down side to this method is that if your chart is very short (and has few delays (have I mentioned how you should NEVER EVER have a chart with NO delays in it?)) then in PAC Display, your button will go down when you click it, the chart will run in a billizionth of a second and set the variable false and PAC Display will scan it every second (that’s the default) and so you will not even see it ‘depress’ while your ‘program’ (chart) is running.
If this is the case, quickest way to fix that is to put a ~2 second delay in your chart.
If I have misunderstood your question, just let me know.
If anyone else has another way of doing this, just jump in and lets know.
