Hi Colton. Welcome to the Opto Forums!!
Like most programming tasks, there are always a few different ways to get the job done.
Since it seems that PAC Control is new to you, I am going to use a flow chart vs OptoScript to get this done.
The reason is that the flow chart will be easier I think for you to pull apart, understand how it works and to expand it out and put your other control requirements into the flow.
Here what I think you have going on at your digital input on your module (ie, whats coming from your prox sensor).
               1     2                             3     4
                ┌────┐                              ┌────┐
                │    │                              │    │
                │    │                              │    │
                │    │                              │    │
                │    │                              │    │
                │    │                              │    │
                │    │                              │    │
                │    │                              │    │
                │    │                              │    │
                │    │                              │    │
                │    │                              │    │
────────────────┘    └──────────────────────────────┘    └────────────
So the shaft turns and at 1, your prox turns the digital input point on.
Then for a small (unknown to us since you did not say in your post, which is fine, but keep it in mind) amount of time, your prox is on, then at 2, it turns off. This 1 → 2 is the blip that starts your timer.
Then at point 3, we know we are done with 1 rev of the shaft, so we get the time in seconds, divide by 60.0 to get RPM and restart the timer and wait for point 4 to move us along back to 1.
This is how I could build a chart to do that…
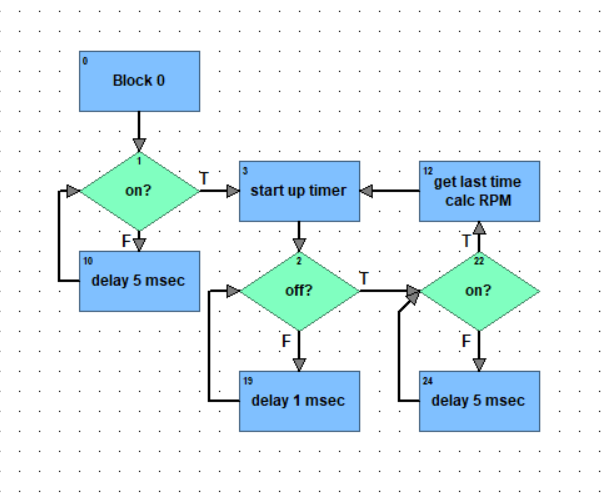
All our charts start with a block 0. We generally leave them empty, its just where the chart starts when it runs.
Block 1 is looking for the time before you get to your point 1. It just loops around with block 10 killing that initial time.
Once the prox turns on, we move to block 3.
Here we start the timer as we know we have point 1 and are waiting for point 2 at this stage.
Block 19 kills a very short amount of time, its simply a loop between block 2 and 19 while we wait for the digital input to turn off. ie, the metal screw moves off the prox.
Once we move to the longer stretch of time between points 2 and 4, that’s where we move the loop between blocks 22 and 24.
Once we get our next on event at point 3, we then jump into block 12 which gets the timer value, does the math and then jumps to block 3 to start the timer again and so we loop waiting for point 2 (the input to turn off).
Thus we just loop around pretty much between points 1 and 3 timing it and doing the math.
Just a quick word on those delays. Every loop in a chart MUST have a delay, if you don’t you will be using 100% CPU needlessly and thats not good for a TON of reasons. So put as small as possible delay in, but always always always put a delay in.
Hope this breaks it down and gets you started.
Always feel free to jump in on the forums ask questions.
Lastly, do you know about our online training?
We have some great starter courses on PAC Control and such. Best of all. Its free.
https://www.opto22.com/support/training-options
EDIT: I know its a few more dollars, but the non-simple version of this module will do the math and output RPM and other values for you. It really takes the work out and will also be slightly more accurate since the timer in the module is higher resolution than our chart.