How many pending writes does the groov AR1 support and how fast are writes written between the onboard Node-Red server and the groov server? I’ve got an application in which I’m querying a device via Ethernet TCP/IP (once a second), parsing the response, then writing tags to the groov server (32 tags at once). Everything was fine with one device connected. Then I added a second device (runs simultaneously in its own flow) and noticed that the number of writes in the queue (as seen in the Node-Red window) kept creeping up (e.g. 32, 64, 96, etc.) until it finally gave me queue full errors in the debug console. I put in lock flags so that each device won’t get queried until all of its writes are finished. Seemed to work, so I added a third flow to handle a third device. Now I’m seeing the same thing, even with lock flags. Each flow is writing up to 32 tags at once, almost simultaneously. At what point does the groov starting rejecting writes because the queue is full?
BTW, multiple writes are accomplished by creating an array of tags then using a split. I saw that mentioned in another post. This might be more efficient if there was a groov node that could write multiple tags at once but I don’t think that exists.
groov itself doesn’t do the queueing: it just handles the writes as quickly as possible. The groov API nodes that we publish for Node-RED handle queueing within the node; I think they’ll queue up to 500* writes before rejecting new stuff, but I’ll have to ask around to be sure.
If your writes are going through a single write node, then the writes are done sequentially in first in, first out order, as fast as groov responds to them.
Providing batch writes through the API has been on my todo list for awhile, just haven’t gotten a chance to get to it yet.
Oh, and what version of groov View are you running? There have been some speed improvements since the Data Store API was originally released, though it’s still not as fast as it really should be. There are some architectural issues in the way (data store values are stored in the project database, which is only accessible via a single threaded job queue) and some iffy decisions that I need to revisit.
Thanks for the reply. It’s version R4.1c (r53943). I know there’s a new version, R4.1e, though I haven’t updated yet. I was definitely getting queue full errors when running multiple flows all writing to the groov. I changed the inject time to 2 seconds from 1 second and ran it over the weekend. That seems to relieve it because there are no write errors now.
Have you guys thought about using prime numbers for your scan rates rather than hitting everything exactly once a second (or at some 1 second multiple)?
You can put fractional inject rates in the inject node, its not stuck at 1 second intervals.
So have one flow at 1.1 second, another at 1.9 and the third at 2.3. Better still if you can spread them even more. Here are some primes that would be interesting to test;
1.1, 1.3, 1.7, 1.9, 2.3, 2.9, 3.1, 3.7, 4.1
The key is to balance functionally with performance.
I don’t really have good answers to any of these. It might just come down to “give it a try and see if it helps”.
There is a definite bottleneck in data store writes, and it’s vexing enough people that I’m bumping it up as a high priority for the next major release.
Was there any major updates done to this? I’m seeing a bit of an annoyance using the Data Store to get my data from modbus via Node-RED into Groov View.
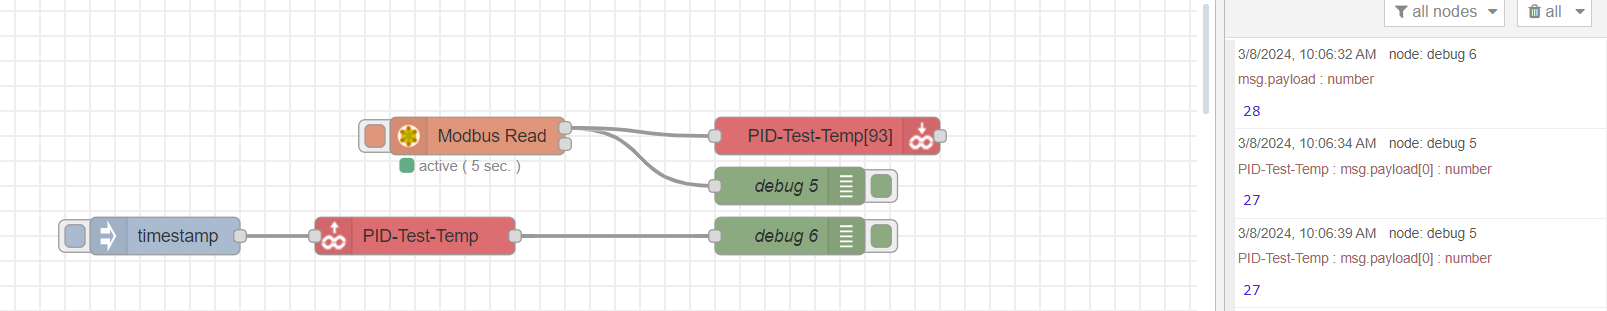
The Data Store really is only writing the initial value that I put in, after that, no dice. Is there a more efficient way to do this? The flow pictured below is just a test flow I am using to try and transfer one slice of data.
You can see from the debug pane that I’m reading the output of the modbus array and also the data store value and they are different - the write node is configured correctly.
I think there are two issues here…
First your comment about how you only ever see one value in the data store, the one after the deploy, after that you never ever see another value? If so, that is very odd and should become an Opto22 support ticket, so be sure to reach out to them and start working the issue to get to the bottom of it. (I’ve never seen this or heard of it before, so its something very specific).
Second, as per your screenshot, Node-RED is asynchronous, so things will never line up the way you expect as per the debug tab in the screenshot.
You might feel more confident if you delete the inject node and connect the groov write node output into the groov node read input. By ‘snaking’ them together like that the message can travel along the chain and it will sync up better. Not perfect, but better.