I have displayed the groov View interface using the local browser on a groov EPIC controller across a company network, and used a Dell touch screen monitor plugged directly into the HDMI port and USB port of the groov EPIC.
The HDMI connection has a refresh time from 1 to 4 seconds, and the remote browsers refresh is 1 second or less.
On another tech support issue, I was told that the local browser that is used for the HDMI connection has a bug and will be updated in the next firmware release of the groov EPIC.
My question is, will I see an improvement in the refresh rate on the direct HDMI connection with the new firmware release?
The delay is so great on the direct connection that the interface is not usable.
Generally we find that delay when the groov View screens are very data or image heavy.
You can quickly test by backing up the project, then pare it down and make it more bear bones.
You will need to delete objects, not just move them into the stash area.
Once you make a ‘lean mean’ project, you should find your speed over the HDMI meets the same ~1 second update rate.
The reason the remote clients are faster is because that web browser CPU is doing all the graphics and your PC is not running the full control programs that the EPIC is doing at the same time as drawing all the groov graphics.
I’m not aware of any bug, so will look into it so I know what they have found, thus cant comment on your question about what it will change.
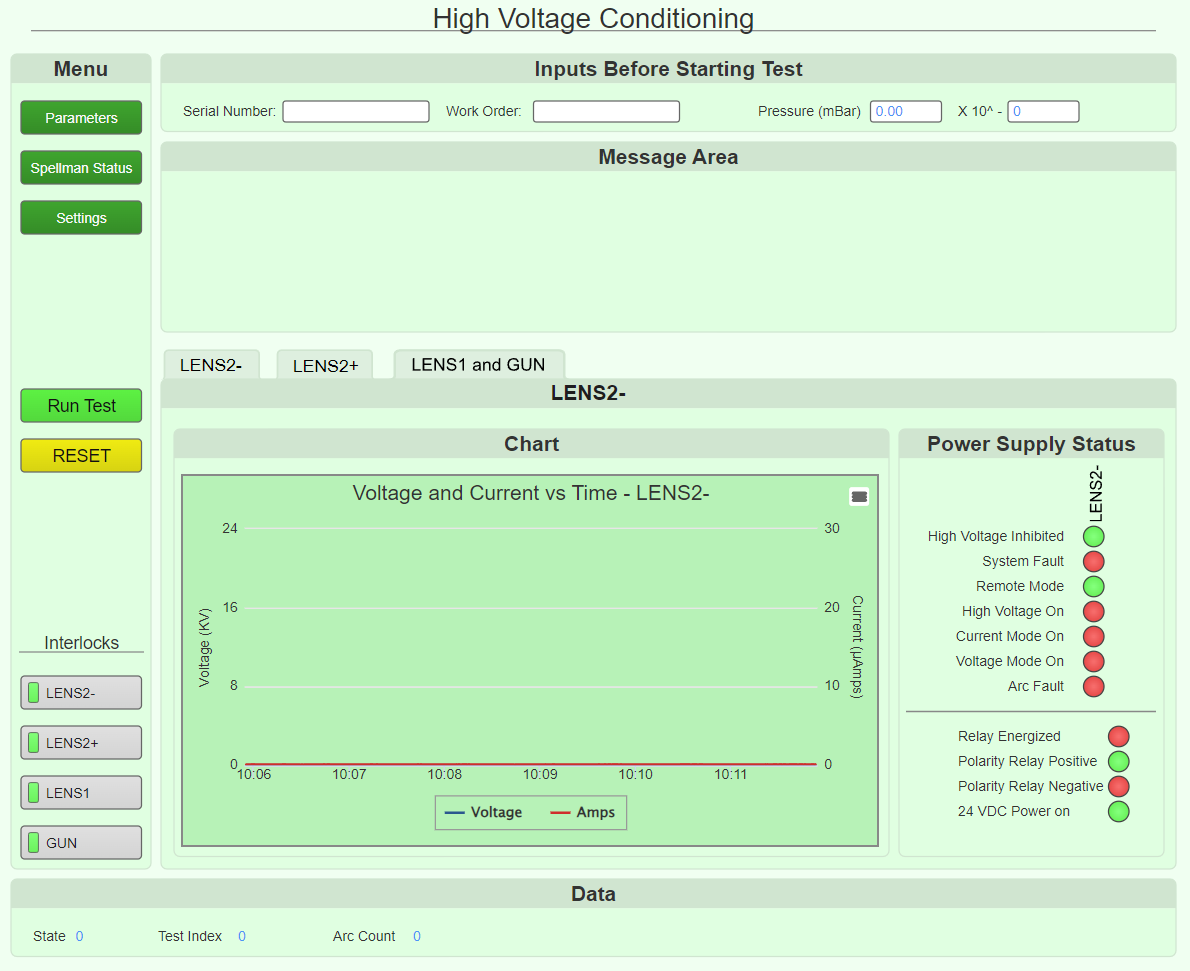
This is all I have for an interface. It’s pretty simple. Are you telling me this can take 3 seconds. Its not really usable at 3 seconds. I can’t switch back and forth to move items to the stash because of the bug I mention in my first post. Moving from build mode to groov View causes the system to crash.
If you have other trends on other pages, they will be ‘drawn’ by the EPIC / web browser in the background.
While we scan trend data in the background, the browser isn’t involved unless the trend is on a page that you’re viewing.
The browser running on the EPIC touchscreen or connected HDMI display is sharing CPU time with everything else running on the EPIC: groov View’s server, groov Manage, the Control Engine if you’re using that, Ignition, Node-RED, etc. If a lot of other things are going on, the browser can become sluggish; we give more priority to the code that runs the I/O than the browser. The remote browsers perform much better because Chrome and groov View’s frontend are running on the remote computer, not on the EPIC itself.
Depending on your monitor resolution, that could be a factor too. Pushing a full 1080p is a lot more work than the touchscreen on the EPIC.
@dale.marion Thanks for the screenshot, helpful to see some of the groov View graphics.
We have a LOT of customers using the HDMI and not have any issues, so lets just do a quick ‘load’ check and suggest some options based on your reply…
What apps are you running?
PAC Control? (If yes, how many charts?)
Codesys?
Node-RED?
groov Manage Data Service? (If yes, what services and very roughly how many tags?)
Shell license installed? (If yes, you running something like a database or Python etc?)
Lastly, a quick way to see what the CPU load is doing (if you are not running shell) is to add the ‘System’ device in groov View and place a text, dial or classic trend in groov View and attach that gadget to the System CPU Usage (%) tag.
Once we know what applications you are running and what the EPIC CPU load is, we can help guide you to ensuring the EPIC is optimized.
Just following up on this one @dale.marion
Did you get a chance to add a ‘System’ device to groov View and see what your EPIC CPU was running at?
Did you get a chance to add some delays to your PAC Control strategy?