I am currently working on a project which involves the control and data acquisition of a FLIR a325sc camera using OPTO SNAP PAC, both of which we already have installed in our laboratory. We are sighting a tube which is typically around 1800 F, so the camera will use a series of actuators to slide up to the IR window, take the picture, and retract back to a safe temperature.
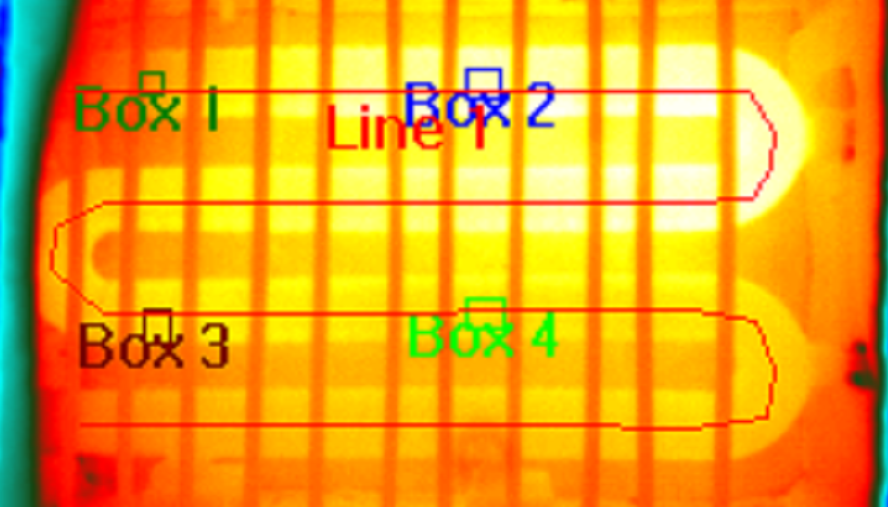
The camera sends the thermal image to the FLIR ResearchIR Max program which can interpret the image, where every pixel of the image is a different temperature value. I have attached an image to show what the FLIR program outputs.
From the program, I am able to draw lines, make boxes, and make points which will export as a CSV file into a folder of my choice. If I open the CSV file from an exported line in Excel, it plots out the line as if cells in Excel represented a pixel on the 240x360 pixel map (resolution of the camera). Because of this, the data shows up as a sideways “W” shape just like the tube and the line drawn. To sort the data and make it useful, I wrote a python script to sort it into an array of (nx1) dimensions where n is the number of pixels in the drawn line.
So the main question then is: Is it possible to use OPTO to tell the camera when to take a picture, have OPTO notice a CSV file appears in the chosen folder, and use the CSV file data to make graphs and do calculations?
Where does your python script run? (What kind of hardware?)
The SNAP PAC you have, is that a hardware controller, e.g. SNAP-PAC-S series or -R series (vs. SoftPAC which runs on a Windows PC)?
Do you have any groov hardware (e.g. GROOV-AR1) in the mix, or possible future plans to include some?
I see that camera has an Ethernet port, is that how you’re currently controlling it?
What kind of graph do you have in mind?
Our PACs can notice a file (like the CSV you mention), read it in, and to calculations on the data. They can also communicate over Ethernet (e.g. sending a UDP or TCP packet to a device you want to control). For graphing you could use either groov or PAC Display (depending on how fancy you want your graphs and if you’d like to view them on a mobile phone or various sized screens).
Currently, we are running the OPTO script and python script on our laptops, but we are considering
upgrading them soon. Right now, its just an HP running Windows 7.
The SNAP PAC hardware we have is the SNAP-PAC-S series.
Right now do not have any groov hardware, but would consider it if it were needed/if it improved the
system significantly.
Currently, the camera is hooked right to the laptop via the ethernet and it is controlled entirely through the
FLIR Research program.
The most important data off we would want off the graph is tube temperature vs. length of tube. This data
would ideally be refreshed in OPTO each time a new picture is taken.
We have charts and displays for each of our furnaces in the lab, so if we were to replace our computer/screen hardware, I know we would have to either find something similar in size to the existing hardware or resize all of our OPTO displays because of the lack of scaling.
Ah, well, the “lack of scaling” would be solved by groov since it’s based on SVG (where the key word there is Scalable Vector Graphics).
How much Python are we talking? A few lines or a few thousand?
And desire to get away from Windows at all? (Or maybe you can’t since the FLIR program might require it?)
Any desire to ditch the FLIR program? (Maybe figure out what key packet that software sends when it does the “take picture” command for example, and send that from PAC or groov?) This might be the case if you’re building a machine and want it all as simple and as self-contained as possible–like many of our OEM machine-builders…
I have about 100 lines of code right now, but I may add to it (nothing too long) at some point to do a few more calculations… depends if it’s easier to execute in the python or somewhere in an OPTO script box.
As far as Windows goes, we are pretty set on it just because it’s what we use throughout the rest of the company.
I am not set on the FLIR program, and would be happy to get away from it to reduce the amount of programs needed to work… less things to go wrong. Some of the tasks the program executes that we would need to figure out include:
Setting the emissivity value of the object we’re sighting.
Setting a few other temperature/distance settings needed to calculate the temperatures.
Setting the transmission value for the window/lens we are using.
I’m not sure which way would be easier/cleaner to do.
My view is to use the right tool for each part of the job.
I think it sounds like you have the FLIR tool making the CSV file pretty smoothly.
Use the PAC I/O to control the motion of the camera and IR shades (if they are able to be controlled by digital or analog signals).
SoftPAC is nice because it can see the c: drive of the computer (where as our rack mounted PAC R and stand alone PAC S controllers can not see any computer drives - but there is a way around that with FTP), so it can scan for the creation of the CSV file and process it straight away.
From there, you can look at using PAC Display or groov Server for Windows to display your data - again, use which ever tool makes sense. PAC Display is a little more rigid in that the display windows have to be a fixed sized (a limitation of Windows OS), where at groov is web based and is built on SVG and thus can scale to fit any device screen resolution.
PAC Display might have some better graphing options, for example, x-y, where as groov is just limited to graphs over time. PAC Display can plot up to 16 pens on one graph, groov is limited to 4.
Both can do alarming via emails/sms.
They complement each other and you might end up using both. Get your feet wet with PAC Display since the basic version is free. (The pro version includes an IP camera window, so you might be able to get a .jpg out of the FLIR and include that - as does groov - which is available also for free with a 2 hour reset-able time trial).
Feel free to ask any questions, and the forum search works really well.
No question you have an interesting application.
My thermal adventures are limited to a FLIR One on my Android phone, but oh so interesting.