Hello,
My team is currently trying to find the best way to build a chart utilizing either codesys or just the groov Build feature itself, and we’re running into a wall.
We are trying to pull data over a changing period of time (the jobs this unit would catch could range from 30 minutes to 5 hours) and place that in a chart automatically that the users can pull and print.
For example, on one job we would have pressure readings, flow rates, density, and other data points we’re currently looking into. At the end of the job we want to pull all the data collected on these charts and be able to print them off from a separate laptop in order to store for records.
Make 2-4 (more or less) groov View trends (classic). Each has a different time span from 30 minutes to 5 hours.
Put the pens you want (max of 4 over two axis) and just do a snip/print screen of the trends after each job.
Or, after each job, you can click the three bar menu (top right) in the trend that best shows your data and download the CSV data for saving/importing etc.
I will need @greichert input here, but I would also look at logging the data you need in a file that can then be downloaded after each job. I don’t know Codesys very well, but it would be snap in either PAC Control or Node-RED to log each job run over the time needed and contain the number of points as needed.
The groov View trends would be visible from any computer web browser on the same network, but any PC would also be able to log into groov Manage and look at the file area in groov Manage and then download the log files from a web browser, so both options would actually be pretty similar.
Writing the job data to a file would be very doable in CODESYS as well. You could collect the data in some array’s. At the end of the job, you could write the arrays to a file using functions found in the SysFile Library (CODESYS Online Help).
As @Beno mentioned, once the file is created, there are lots of options for accessing the file. Beyond groov View / Manage, Node-RED (and shell access for that matter), you have options within CODESYS as well. I’ve never used them myself, but I know the OSCAT Network Library (OSCAT Network) has a SMTP Client for emailing and a FTP Client for transferring files.
Is there an external SCADA system that might be used to generate the chart?
With shell access I have used Gnuplot and shell scripts to automatically create charts that could be pushed to a server or downloaded. Building Gnuplot and its dependencies from source is a prerequisite. Gnuplot has a learning curve, and there are limitations in what it can do. The charts don’t look great, but the charts were sufficient for what I was doing at the time.
There are plenty of methods for obtaining data from the EPIC (https://developer.opto22.com/ can help you with that), and then you can format the data into Gnuplot format.
I used cron to automatically run the scripts and invoke Gnuplot. The process was automated and tested.
This approach took quite a bit of time and fine tuning.
Thank you all!
I’ll be honest it totally didn’t click that any computer on the same network would be able to go in and just pull the data. I appreciate the help and we’ll be looking at these other avenues as well to see what works best!
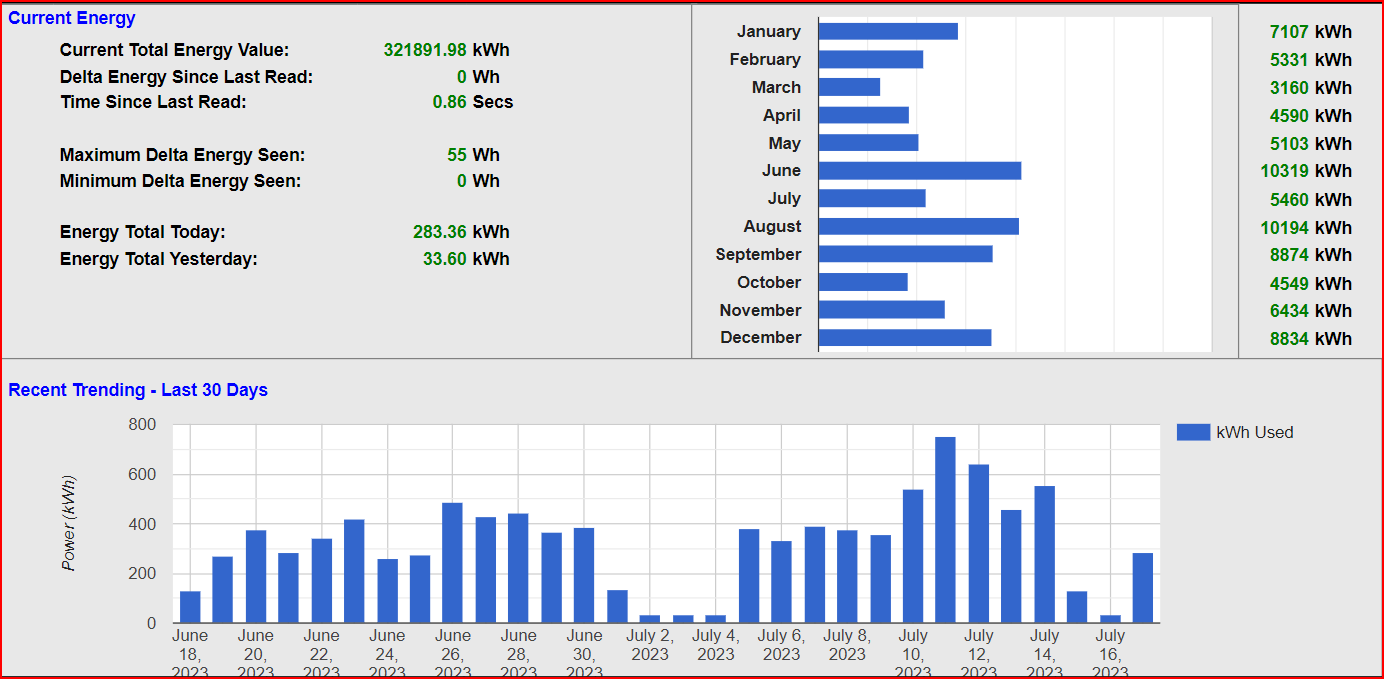
If you want to just snag charts off the EPIC, another way to do so without having to install other libraries/dependencies is to leverage Google’s chart API’s. The main downside here being you would need an internet connection on the device viewing the EPIC controller(s). I would not recommend his method if you have a lot of data to render.
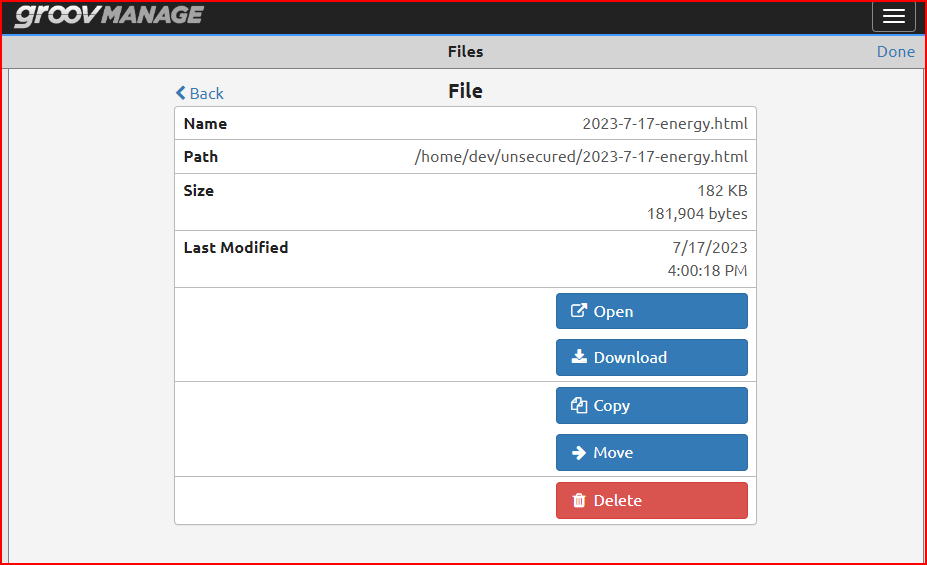
You would write a script that builds and saves an HTML file to the secured/unsecured directories. This would be a very simple HTML file with the data arrays and a bit of JavaScript that calls Google to render it.
You can then download the charts from groov Manage or even view them directly by clicking “Open” where your browser can render the chart.
A quick example/proof of concept with bar and column graphs from one of my projects. Clicking “Open” will render the chart in a new tab where it could be printed.