I would like to monitor the bandwidth for our opto systems. Can anyone point me in the right direction to get something setup?
Few questions:
Is this for TCP/IP usage?
At what level do you need bandwidth monitoring? For every Opto22 device or for the local network out to another network?
We are a small lab segregated from our corporate network. Around 15 computers and 15 controllers. And yes TCP/IP. We wanted to monitor the controllers and the MMI(HMI) computers.
Check if your network switch has SNMP capabilities. You can then get/downlad an SNMP monitoring tool to look at the per port bandwidth from the switch. You will need to figure out from the switches documentation for what SNMP OID you are looking for. Each Opto22 device and computer will need to be the only device on that port of the switch to get per device statistics.
Opto22 devices also have built-in SNMP, but I don’t know if they give any information on bandwidth - never looked.
Thanks! I think we are putting in new switches in the next few weeks. So I will investigate the capabilities once we start installing them.
Wireshark is a good tool
@ClintN Great question and fantastic timing… I am just in the process of doing exactly this in my lab as well.
While I don’t have solid answers for you yet, I wanted to let you know that I am looking into it and really wanted to encourage you to keep this thread going (as will I) with what we discover.
Short version.
I have 3 managed switches, a Brocade, Dell and TP-Link (I wanted to test a variety).
I have MIB’s for the Dell and TP-Link.
My SNMP application is ‘The Dude’ by Mikrotik.
The Opto 22 MIB does not have any bandwidth OID’s, so that is what I am going to try and track down for both of us.
I also plan to use the SNMP Node in Node-RED to bring the bandwidth data into both a SNAP-PAC Controller (for say PAC Display) and into groov for displaying (and perhaps alerting via email).
Questions for you.
What SNMP software were you planing on using?
Are there any other SNMP or network stats you were after?
Fantastic. Currently we aren’t using anything so I’m checking websites and youtube videos to figure out some option. We got some new switches in but I’m not sure of the make/model yet. Hopefully going to discuss a little bit more with my higher ups tomorrow. As far as other stats as of now we are just wanting bandwidth. If I can sort this out I’m sure more will get added.
What I found on my switches (HP/3Com) and from searching the web is that the OIDs for port traffic are standardized and are defined in RFC 1213.
Outgoing octets (bytes) are kept in 1.3.6.1.2.1.2.2.1.16.{port #}
Incoming octets (bytes) are kept in 1.3.6.1.2.1.2.2.1.10.{port #}
These are accumulators, so if you want bandwidth then take the difference of two samples over time.
Useful site to find what is kept in these (much easier than reading the RFC):
http://oid-info.com/get/1.3.6.1.2.1.2.2.1
Sorry for the long post. Also sorry if its a bit jumbled - my brain dumps are never coherent. We can try and edit it based on questions (if there even any) in due course.
Begin with the end in mind. You want to monitor bandwidth. This reply is focused on that goal.
Since most networks these days are ‘connected’ via switches, bandwidth is going to be something we need to look at per network drop and then use some software to total everything up (if and only if total bandwidth is the goal. Just knowing what each drop is can be valuable, enlightening and adequate in and of itself often).
You could, as zhhpei said, use Wireshark, but that is simply the wrong tool for the job. It is fantastic at ‘deep packet inspection’, but to use it to count total traffic over time would be uncomfortable. Also, you would need to install a hub at each drop to allow Wireshark to see the traffic on that drop.
Safe to say, Wireshark is not the right tool for the job in this case.
SNMP.
Simple Network Management Protocol.
This is the right tool for the job. It has been around a lot of years, is a bit of a standard, and works on Windows, Linux and PAC-Controllers.
While you can do parts of it by hand, or through OptoScript, there are better ways… That said, Mary has a great post on SNMP Traps, which we are not going to cover here, but I do highly suggest that you go read it.
The best bet is to use some SNMP monitoring software. There are Open Source, free and paid options. Google will guide you. (I have tried Cacti, Nagios, Zabbix, Ntop and The Dude). Look closely at the features, look at the amount of hosts the free versions support, look closely if the free version shows ads on the reports etc etc.
In the end, you just have to pick one and stick with it (wort’s and all). The longer you work with it, the better you will get at working around any short comings it has. One feature I would look at it is reports and alerting features. None of us have time to sit and watch the watcher, we simply want daily/weekly reports and an email the moment anything goes awry.
I chose ‘The Dude’ from Mikrotik. We have been using it on and off for years. I like the mapping feature. Its not open source, but it is free.
One major gotcha with this application. They no longer are developing the Windows server. They are only developing their routerOS version.
Not all the features of the Windows platform has made it over onto the RouterOS version yet, so its sort of in a no mans land at the moment.
I am happy with the features and bugs on the Windows version, so I am mostly using that, but I have purchased their minimum level router (Mikrotik hEX RB750Gr3) to run it on.
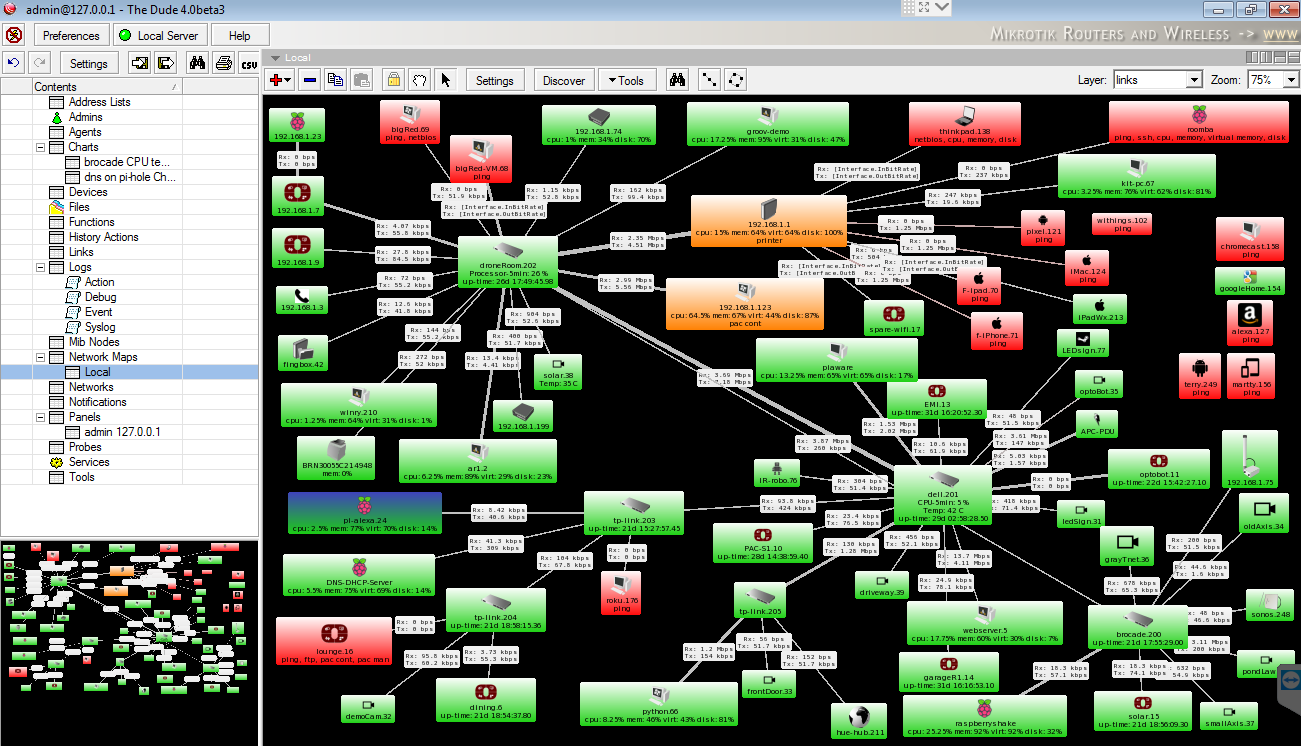
Here is an auto generated map of my lab generated by The Dude.
I am a very graphic/visual guy, so really like The Dude for this reason. Most of my interaction is through this map.
Double or right click on each object (I don’t mean to ‘sell’ The Dude, most SNMP applications are the same, so just bare with me) to expose the features of each device.
Green is all services up (you can add services like port 2001 and 22001 for Opto 22 devices), orange is one or more services are down and red is all services down.
On the links you can see some data, these are the current bandwidth values for that device to that port on the switch.
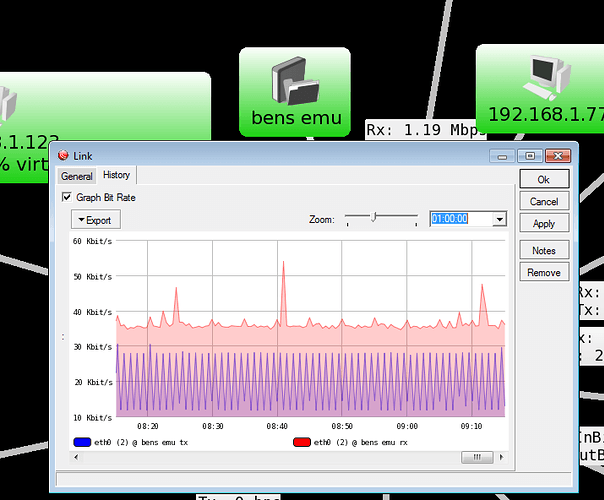
Hovering over them shows a graph.
This is for an OptoEMU-SNR-3v. It monitors the lab power. You can see that it is uploading power readings (the blue spikes) and is receiving a lot of broadcast packets and data addressed to it.
So how did we get here?
The main advantage of the SNMP software is that makes the SNMP tree structure a lot LOT simpler to work with.
Most Ethernet interfaces have some SNMP stack built in, so at the very least, to get SNMP up and running on your hardware, it should just take a software package to install.
As I said in my last post, we are using a few different managed switches. The brand does not seem to matter, more that they support SNMP and have a management console, either command line or web page interface.
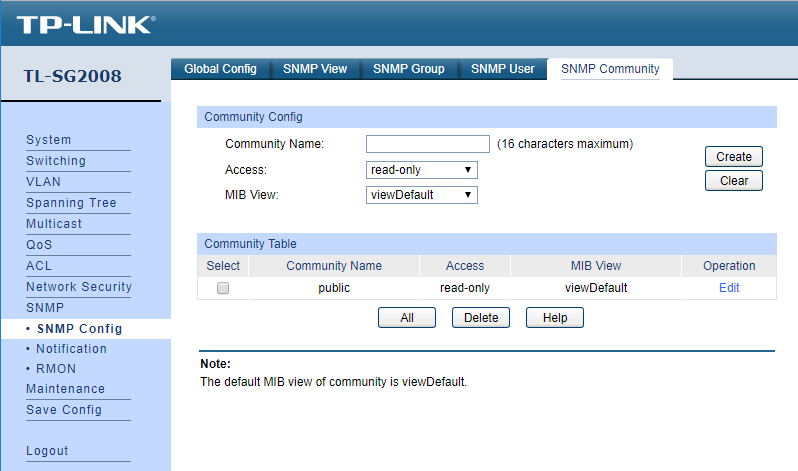
Here is a screen shot of the TP-Link;
This is one of the smaller 8 port, but the 24 port and 48 port look almost the same.
The important part here is that under ‘Global Config’ you turn on SNMP and then under ‘SNMP Community’ you add a community name.
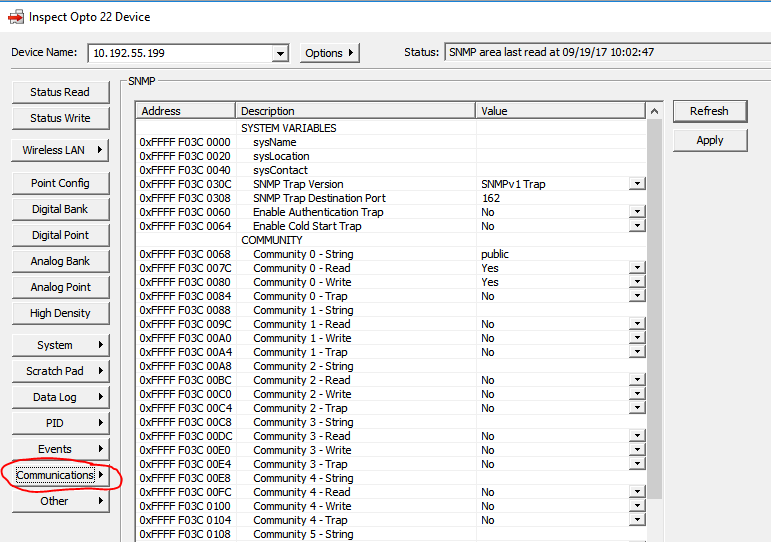
To check what it is in your Opto 22 devices, open PAC Manager, inspect the device, click on communications and then SNMP;
Thoughts about this. IT guys might like to change the community name so that it is a little more secure. You can also set up a user/password for the SNMP user/community/group. I recommend that you adhere to any of their recommendations. That said, for my lab, I set it to read-only and left the default group and community name as ‘public’ and no user/pass.
One of the reasons for this is that I wanted The Dude to be able to do a scan (discover) of the network and did not want to have to set up each device or several profiles for the SNMP user. Something to consider given the size of your network. If you have a few devices, you might make those changes (use PAC Manager to do it for Opto devices).
Note that some switches will allow you to monitor SNMP areas (called OID’s - Thanks @philip for that link, its very very useful). I don’t recommend that method. It only monitors one OID and it has no way of doing math on that value.
Once you have your SNMP client enabled and your SNMP community name saved, you can then unleash your software to scan the network and walk the SNMP tree.
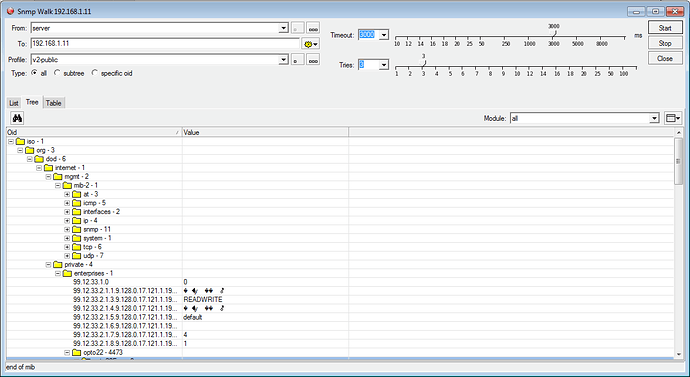
Here is a small section of an Opto SNMP tree screenshot;
I have closed a lot of the tree folders, they go on and on and on and on and on.
You can drill your way into any leaf of the tree and look at just that OID data. Thankfully a lot of the SNMP software knows the tree structure (as I said, its a lose standard) and will pick the right parts for automatically saving a HUGE amount of time.
Here is the Incoming OID that @philip posted; 1.3.6.1.2.1.2.2.1.10.2
Here is how it looks in the tree;
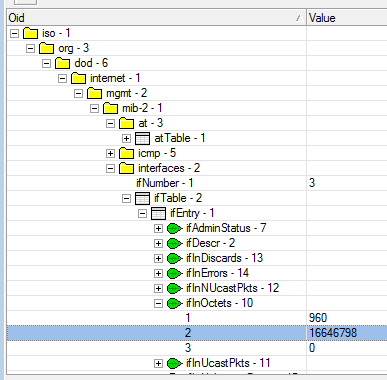
So now you can start to see the real value of the software for two reasons.
1. I did not have to look anything up, I just had to tell the software that I wanted to use port 2

On opto devices, you can see that port 1 is loopback, port 2 is Eth0 and that is the one I am connected to.
2. The software takes that accumulated value and divides it over time and BOOM! there is your bandwidth. (In a nice graph).
MIB
A quick word on MIB’s.
MIB’s or Management Information Base work hand in hand with SNMP.
MIB describes vendor specific sections of the SNMP tree that are not in the standard.
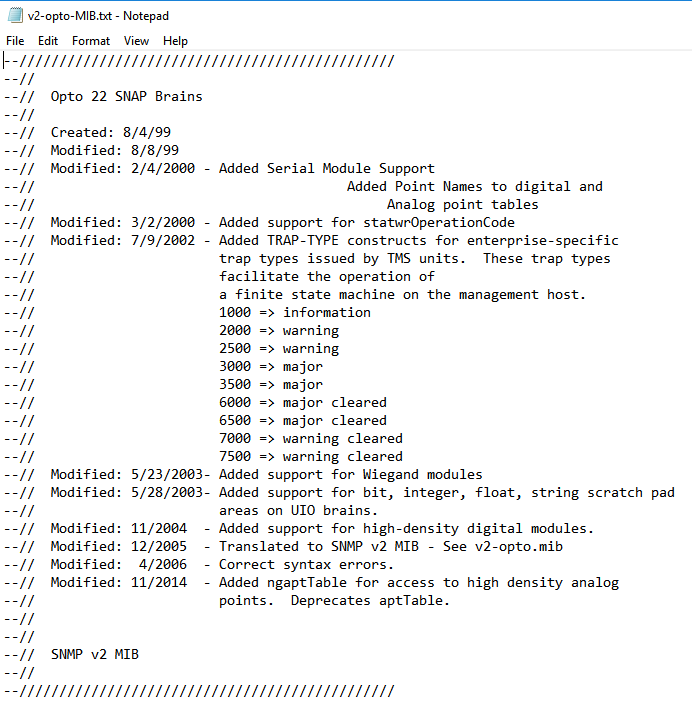
Here is the front of the Opto 22 MIB;
As you can see, they are all things that are unique to Opto 22.
Most managed switch vendors do the same thing, the SNMP standard takes care of all the interface data in/out counters etc, but they might add CPU use or CPU temperature, Fan status/RPM and things like that… You will find those OID’s in their MIB.
Most network management software allows you to add MIB’s as needed.
So, to summarize.
SNMP is a rough standard.
OID’s are a rough standard.
Most network monitoring software knows about those standards and so can pick good values to give you the most bang for your buck (and time) out of the box.
What about PAC Display on a Windows PC?
Yes, Windows PC have SNMP, but its not turned on.
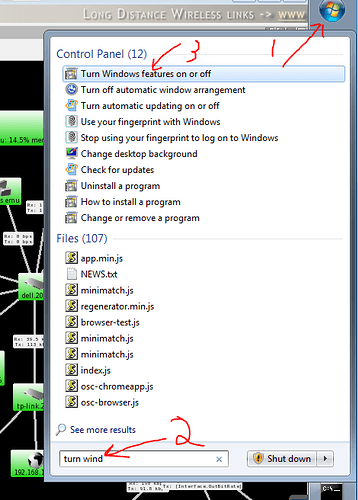
To enable SNMP on a Windows 10 pc, click on the start button and type in ‘turn windows features on or off’
From there, check the SNMP feature on. Wait a moment for it to load.
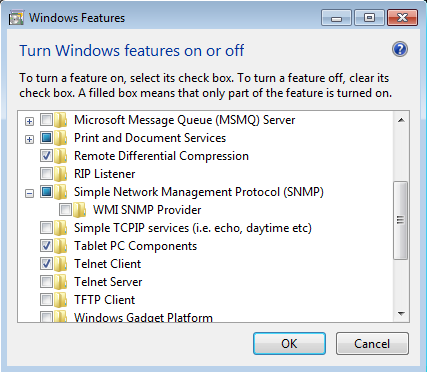
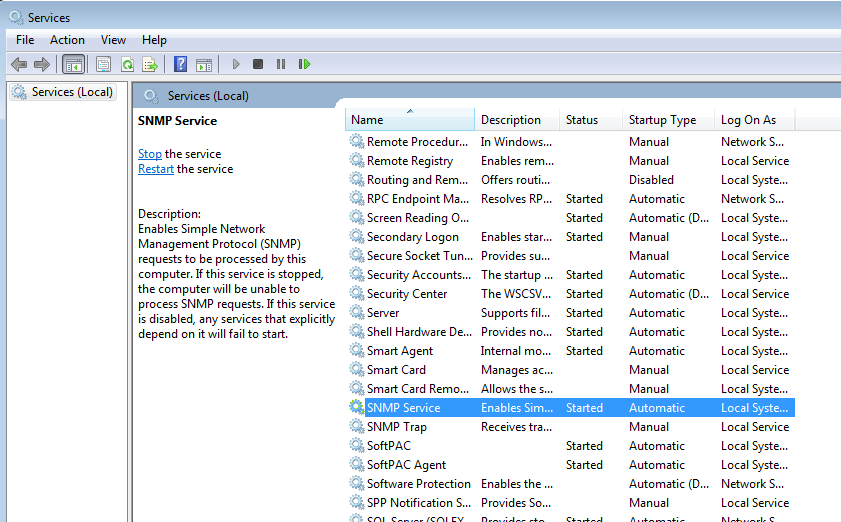
Once that is done, you need to add the SNMP community, to do that, click on Start and type in ‘services.msc’.
Once that opens, drill your way down to SNMP
Double click on it.
From there, click on the Security Tab and add the community public (or what ever you ended up calling yours);
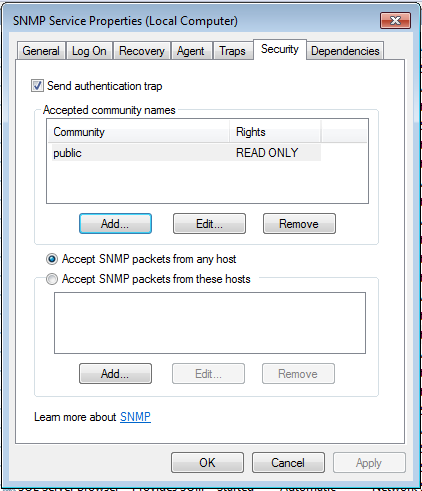
Add it to the list, IMPORTANT, make sure to change the dot from Accept SNMP packets from these hosts and Accept SNMP packets from any host… and then click Ok out of all the dialog boxes.
Now you have SNMP enabled on that PC (open the firewall for port 161 UDP if you need to).
You can now point your network management software at that IP address and get the bandwidth data for PAC Display (and every other application running on that PC over the network).
What about using Node-RED?
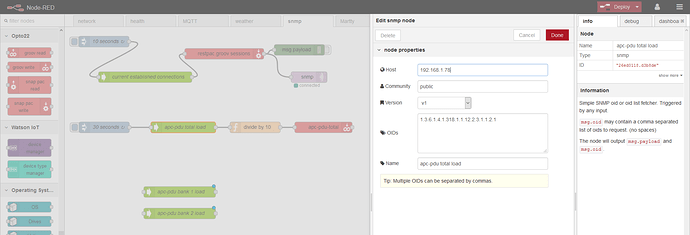
Install the SNMP nodes.
Set them up something like this;
You need an inject node to say how often you want to read the OID. Sorry, no nice tree view here, you have to know the exact OID you want.
Then push it to either a PAC Controller (useful for using a timer to work out rate rather than just amount - depends on what your OID is returning) or a groov Data Store (as I have done in lower version of this flow).
Phew. We made it.
tl;dr
- Get managed switches, turn on SNMP.
- Enable SNMP on your Windows PC.
- Configure your SNMP community in all devices (or leave it as the default public).
- Pick some network monitoring software. Download it, install it, unleash it on your network.
- Profit.
Heresy!
I wrote a bitpacking / unpacking subroutine in OptoScript that I tested with SNMP protocol and it can return arbitrary OID values - I never used it on any projects (the SNMP part) so it isn’t fit for public consumption, but if anyone was interested I could polish it up a bit. Interestingly, (to me anyways) my very first post on this forum was asking about this very thing: SNMP Manager - #5 by philip
Huh, well… excuuuuuuuse me for missing a years old post (with no code) :-}
I am so happy that we have Node-RED now, makes that sort of thing that we all went back and forth on all those year ago so much easier and cleaner. Even the serial stuff would be a lot more straight forward now.
And ironically, the ‘last’ thing I have to sort out in my lab is a serial APC UPS…
I had no code for that way back then- the customer ended up going a different route, so it never went anywhere. About a year ago I used SNMP as a proof of concept for some bit-packing routines that are useful for serializing/deserializing a variety of protocols. Basically you describe the protocol in a specification string and the routines will either create a buffer to send or turn a received buffer into regular Opto types.
Been there, watch out for APC’s serial port pinout - it isn’t normal. If you stick with the cable that APC provides, all will be well.
A very good lesson, thank you, Beno!
I really appreciate the info. I believe I’m going to go with the Dude software as well. We are switching out our pc’s and our switches over the next few weeks so it seems like the perfect opportunity to set this up.
Running under windows, should I download that version of Dude? Where to download? Thank you
If you want to run The Dude on a Windows PC, keep in mind that this is the last version for x86 hardware.
Support is limited from Mikrotik.
http://www.mikrotik-software.de/downloads/dude-install-4.0beta3.exe
Thank you. What platform does it run on?
Platform? Not sure I understand your question.
I’m running it on a i5 Laptop with Windows 10.
Getting email notifications going on a Windows install of The Dude was not obviously straight forward to me… In the off chance that others may also have this question, here is the way I did it.
Note, there seems to be many different ways to send Email from a Windows PC, you may already have something running, you may find a better way. If so, please let the Forums and those who follow along know by posting it.
The Dude can generate a few different notifications… Beeps and popups among them, but of course, you need to be in front of the PC that is running The Dude to get them. I wanted email notifications.
Here is the first glitch, out the box, The Dude can only send unauthenticated emails to a local (IP address) email server. Great for a big company that has something on site, but not for the small user.
As I said there are a few ways to send emails from a Windows PC, here is how I went about it.
1. Make a gmail account just for The Dude.
Two reasons for this, 1. You will be using two factor authentication for your main/personal/any gmail account and that’s tough to get working for an application. 2. You really don’t want to dumb down your personal account to get it working with Windows. In the end, you will be able to send any email account your notification, but where it comes FROM has to be a step above a throwaway.
2. Once you make that gmail account, visit this URL; https://accounts.google.com/DisplayUnlockCaptcha and click on allow access.
What this is doing is allowing an app to send emails to that gmail account.
3. Visit this ULR; https://www.google.com/settings/security/lesssecureapps and allow less secure apps. What this is doing is allowing apps with basic authentication to send emails.
These two steps are NOT optional. You must do them to allow an application to send gmail.
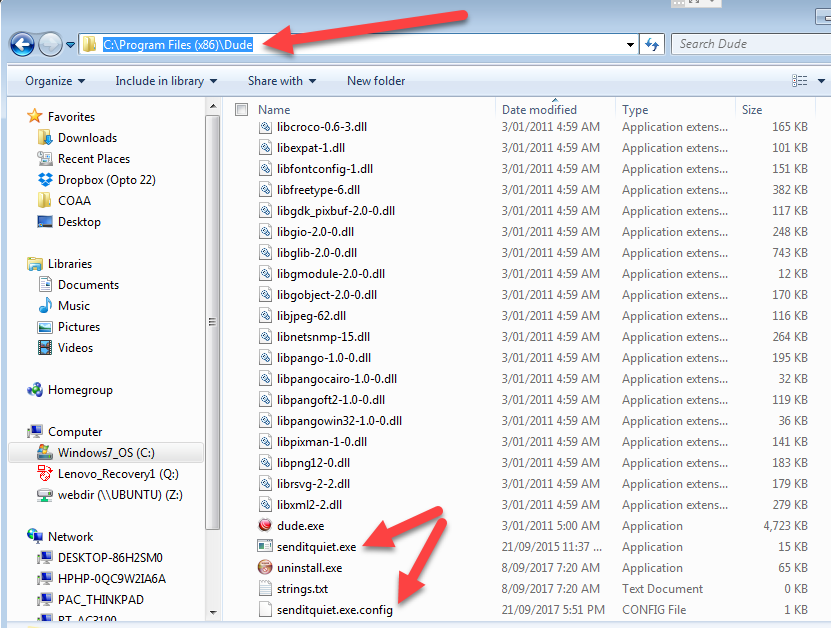
4. Go and get senditquiet.exe from these guys; http://commandlinesendmail.blogspot.com/
Unzip it and copy the two files into your Dude folder as shown here; (Note, if you have a non-standard install location of The Dude, copy it there).
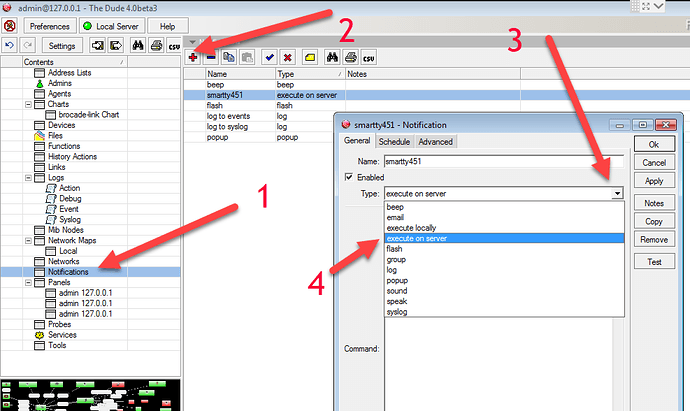
**5.**Now go to the Notification panel in The Dude and set it up as shown;
6. We are going to be running the senditquiet.exe every time we want to send an email. So in the ‘Command’ part of the notification, here is the string that you will need. Just copy/paste this into The Dude notification box.
Note, change the username, password and so on to match your needs.
“c:\Program Files (x86)\Dude\senditquiet.exe” -port 587 -protocol ssl -s smtp.gmail.com -u gmailaddress@gmail.com -p gmailpassword -f fromgmail@gmail.com -t toemailaddress@somecompanyemail.com -subject “[Probe.Name] on [Device.Name] [Service.Status]” -body “[Probe.Name] on [Device.Name] [Service.Status]”
Make sure to press the ‘Test’ button to check it works.
If not, you can add ‘-logfile error.txt’ into the command and look in the root of your C drive to find that text file, it will contain information for you to start to Google to figure out why its not working.
Once that is up and running, you can just add this notification to any device in The Dude.
Note you can set what states you want to notify on and you can tweak the information included in the notification by clicking on ‘Insert Variable’… But here’s the thing… I cant yet figure out how to trigger a notification (email) on high bandwidth!!!
The main thing I wanted to do, and I cant figure out how to do it!!! Baaaaaggggggthhhhhhhh!!!

