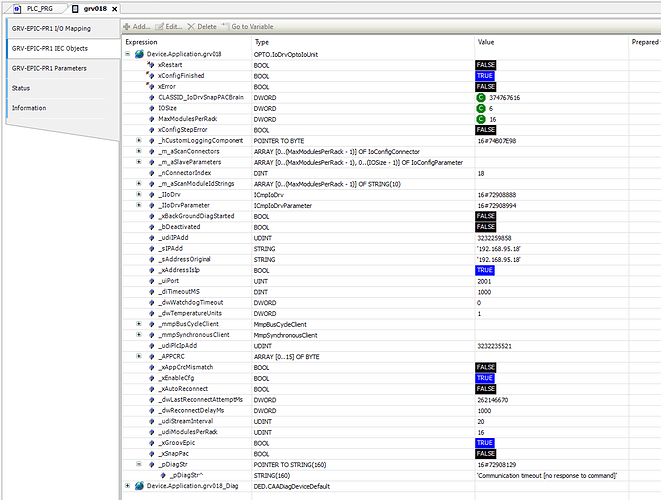
We are looking to see if we can create a log of any errors and the error message but we can’t seem to figure out how to get the _pDiagStr^ string when an error occurs. Anyone know of a way that we can grab this string so we can send it to Ignition? If so, is there a way we can clear this message?
You can access those using the below code:
VAR
diag : POINTER TO STRING;
diag : STRING;
END_VAR
diag := GRV_EPIC_PR1._pDiagStr;
diagStr := diag^;
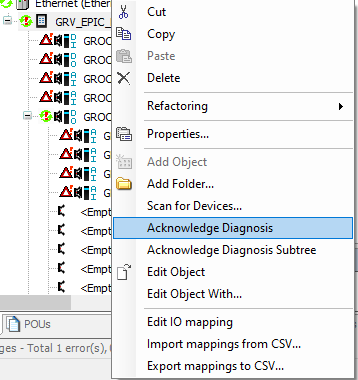
You can clear it by right clicking on the device and selecting acknowledge diagnosis.

I am unsure if it is possible to perform the Acknowledge Diagnosis programmatically. I have reached out to Codesys to see if that is possible.
I am not sure if this information is the most useful. typically you will see the message Communication timeout when you go online with change or download.
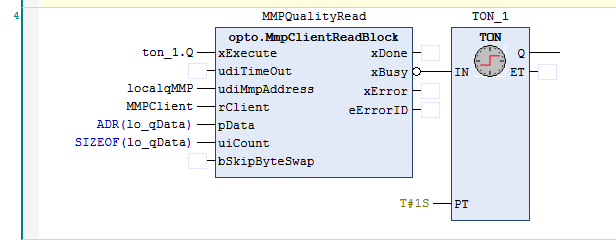
I would recommend using the Opto MMP function to get quality data at a much granular level for each channel.

Here is a sample MMP project for you.
I’m testing different situations before we put a grv-epic-pr1 running Codesys into production. On my desk I have a grv-epic-pr1 running Codesys and a learning center as remote I/O. When I have the learning center defined but nothing happening in the codesys project, I can login and everything looks good. When I try to move the temperature input on the learning center to a REAL variable, the learning center disconnects and I get ‘The bus is not running. The shown values are perhaps not actual’ on the module tab. and ‘Communication timeout [missed incoming stream]’ as the _pDiagStr for the brick and modules. Any clue what the issue could be?
That is not normal behavior. I would recommend contacting our product support team.
Phone: 951-695-3080
Email: support@opto22.com
Thanks for your help @greichert. I’m able to get the error string with your example.
I received a reply from Codesys. Unfortunately the Acknowledge Diagnosis is only available via the Codesys Development system. It is not available via the application.


