By “debugging” I mean using PAC Control’s Debug mode to step through your logic and figure out why it’s not behaving as you expected. Usually in Config mode you’d have checked the menu option: Configure > Full Debug so that you can step into blocks and see what’s going on.
Here are a few techniques I use when stepping through, in this case, a big loop that takes a while to run:
1. F10 is your friend
2. Avoid looping if there’s a built-in command
3. Break up a loop
1. F10 is your friend
You may have used the mouse to step over and into blocks, but did you know you can also use the function keys? For example, here in my big loop that takes a while to run, I may want to step through or into something in this loop, but not until I get up to a particular index.
[click on image to see animation]
Rather than stepping through one line at a time as shown above (same applies when stepping over blocks of all kinds), I can watch that nIndex fly up without lifting a finger. I just park my finger on the F10 key and hold it down. When nIndex gets close, I can do one step at a time until the relevant nIndex. I can also use F11 for “step into.”
2. Avoid the Loop
This isn’t exactly a debugging tip, but it could save you some coding, which can lead to writing bugs.  If you’re just initializing a numeric or string table to a bunch of the same thing, check out the commands MoveToNumTableElements or MoveToStrTableElements to do it for you. No loop required!
The syntax is identical for both commands, and -1 for the “End Index” tells the command “fill the whole table” so you don’t have to do the extra step of using GetLengthOfTable first. They look like this:
[INDENT]MoveToStrTableElements(/From/, /Start Index/, /End Index/, /Of Table/);
[/INDENT]For example, to fill my nBigTable with my favorite number (22, of course), I’d just use:
[INDENT]MoveToNumTableElements(22, 0, -1, nBigTable);
[/INDENT]All done! No loop needed!
3. Break up a loop
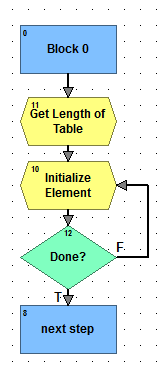
Normally, I could do this same thing for a loop in regular blocks by just adding an increment on nIndex and checking to see when that reached nLengthOfTable, like this:
If, for debugging purposes, I want to set a breakpoint (not supported within a block, unfortunately) when I get to a particular index, I’d just add one more just-for-debug condition to check for that value. Like this:
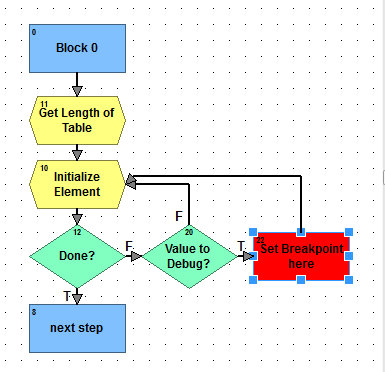
Once I’ve set the breakpoint on the condition I want to examine, I can let her rip, then step individually through the logic I want to watch closely. Just a little bit of simple “instrumenting,” AKA debug code.
Hope that helps.
-OptoMary
p.s. Did anyone spot what was missing from my loop which I might want to include if it takes more than a few seconds to run? I’ll send an OptoPrize to the first person to reply with the correct answer (or a handy debugging tip of their own). Quick! Type fast!