The controller is a bit overloaded: most* of the time it’s taking 1.1 seconds to respond with all of the tags requested. You might want to back off the scan rate a bit.
With that said, at most you should need to wait 2 or 3 seconds before your page is fully populated with values. (1.1 seconds + the 1 second poll time from pages.)
There’s definitely something screwy if it’s taking 15 seconds to fully populate all the gadgets on your pages. Digging into it.
[*] That 3.01ms minimum request time is probably for a write. There’s only a single value involved there, so it goes a lot faster.
Same deal as Tasha’s setup: your controller is a bit overloaded and you’ll probably want to back off on the scan rate a bit, but at most you should be seeing 5-6 seconds before your pages are fully populated. There’s something screwy in there that I need to figure out if that’s not the case.
By any chance do you have a lot of events/alarms setup?
I had a customer that updated and the groov took 45 seconds to refresh tags. They had a lot of events that were no longer needed - when they deleted the events, the response time went back to the normal 4 seconds or so. I imagine that a lot of trends/charts could cause the same issue.
I have 10 Alarms setup. But I just recently set them up after installing the last update and the delay was happening before the alarms were configured. It was taking about 30 seconds for my sliders and set points to populate but my temperature inputs populate as soon as I open the page. I turned down my scan rate to 3 seconds from 1 and the pages seem to be responding better now.
I’ve been following this thread (since I started it) and have a question; Would it be better to scan individual devices (E1/B2) instead of hitting the S1 for everything? I would be scanning potentially 30-35 separate devices.
What if I setup an OptoOPC server (still struggling to set one up successfully) and hit that with the groov instead of the S1?
Well, I would too if that were choice at this point…
As far as making any of those changes, the project is long since over and the work it takes to change tags on Groov is just not worth the effort, especially when you can’t be confident it will fix the problem.
Yes, I agree 553 tags is a small project, but this is the number of tags not in the project but what Groov is polling. Do I get the sense here that Groov polls the vars in Pac Control one at a time? If that true then there in lies the whole problem. If I had known that, I could have made a point to put everything in tables, assuming that the tables are polled as one.
I feel for you, Johnathan…
Can you write a page describing how Groov handles reads and writes (especially to S1/R1/R2)? It has been my experience in the past that you can’t expect integrator’s to do a decent job of integrating if what they’re working on is a black box. Every time I’ve had problems in Pac Control and Pac Display it was because I did not know who the data was being handled internally.
Handing anyone a piece of software without and understanding of the underlying processes is always going to amount to problems.
Thanks for your help in all of this.
For a PAC, groov requests all the variables it needs in one request (this can span multiple packets if needed). The request includes the tag name, so long tag names would make the request larger, but this is fairly minor. The PAC responds with one variable at a time (separate packets). This includes individual table indexes, so a request for 10 indexes of a table will have 10 responses.
For an IO Unit (OptoMMP) and modbus, groov makes a separate requests for each tag, which is less efficient than reading from a PAC, but could be helpful in spreading the load.
Hopefully Opto continues to use PACs with their groov testing so they stay conscious of the performance issues, as a PR1 will respond much faster with groov and SoftPAC on the same device.
For PAC: I’m not sure why this particular method was chosen in the first place. There’s alternative that I’m looking into, but the original implementers decided not to use it without documenting why. (They’ve long since moved on.)
I didn’t realize the controllers dribbled the responses back until this past winter. :-/
I/O units: due to the layout of the memory map (see Appendix A of the OptoMMP Protocol Guide for details), the chunks of memory we need to read for points are kind of scattered about. There’s not really a straightforward way to avoid small reads, with the possible exception of scratchpad memory.
There are some improvements I could make though, such as always pulling in all digital point states (but that doesn’t help SNAP high density or groov digital modules), or always polling latch and counters along with states (but that means I’ll likely be polling data that isn’t needed), etc.
The memory map makes it straightforward to write a custom client for something, but for general purpose it’s a little cumbersome.
Modbus: this could definitely be improved. I should be combining register ranges as much as possible.
OPC-UA: we rely on the protocol/library we use for hopefully making things efficient. It’s mostly up to the server we’re talking to.
I do most of my testing with groov View running on a 2011 MacBook Pro against a SNAP-PAC-R1.
Edit: Oh, and the PR1 will respond faster than a SNAP-PAC whatever regardless: much faster processor. In my testing, again with groov View running on my laptop, the PR1 response times for a page reading 128 non-contiguous entries out of a large table were roughly 10x lower than the SNAP-PAC-R1.
Have you looked at using UDP streaming for IO units? Some people may use it for other purposes, but most probably don’t use it at all. If this could be enabled, groov could write to the custom streaming area which addresses it needs and then start listening. The trick would be to turn the streaming off when it wasn’t needed (maybe an event reaction type watchdog…) Should be very fast.
Edit: Even without the UDP streaming part, the custom config area could be useful to make the addresses contiguous.
Barrett,
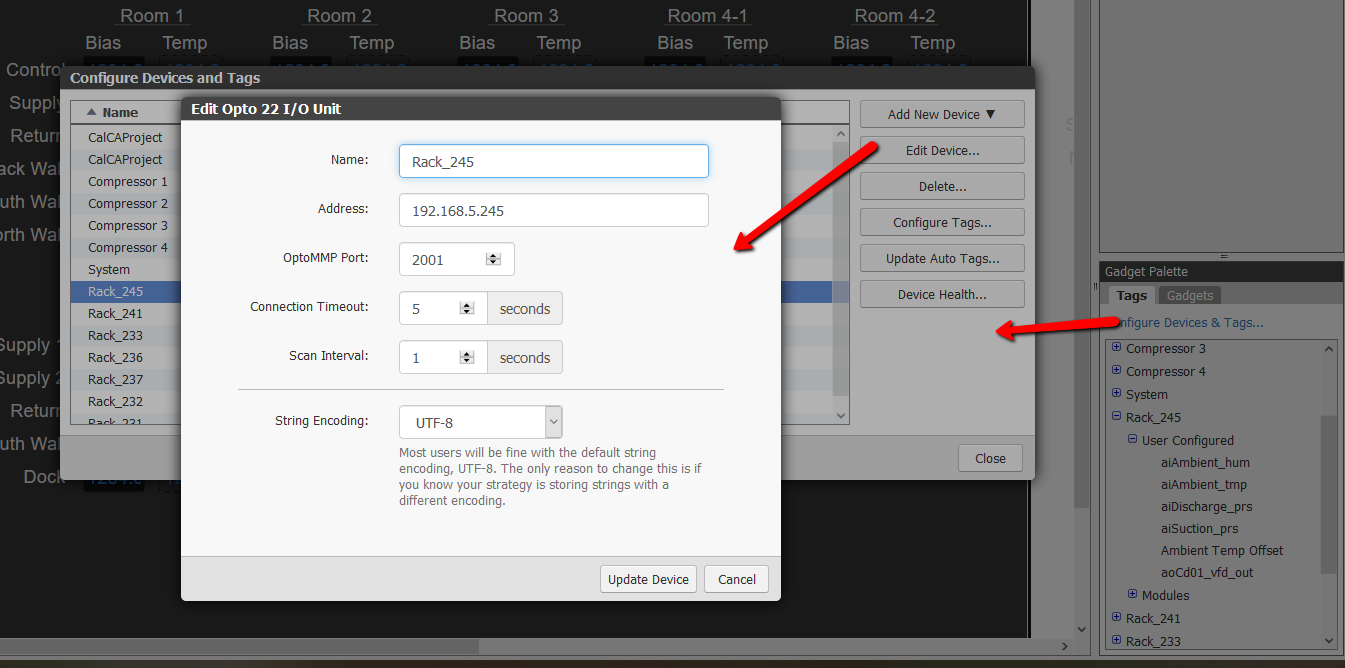
Are you thinking you need to change the polling rate of each tag? I didn’t. All I did was I went into Switch to Build Mode clicked on Configure then Devices and Tags then Highlight your strategy click on Edit Device then change the scan interval to 4 seconds click Edit Device then save all changes and switch to Groov View. This changed my polling rate globally for all my tags and pages. Not sure if this is what you’re looking for but it worked for me.
I was thinking it was in the configure/project menu but I looked in a 4.0c project and it wasn’t there, only the video gadget time was there. Then I looked where you suggest and it wasn’t there either.