I have been trying to develop a gadget that shows the trend of my laser machines for the past 24 hours, however, the time axis seems to be random.
If anyone can point me to the tab that I can fix my time, I would be grateful
I have been trying to develop a gadget that shows the trend of my laser machines for the past 24 hours, however, the time axis seems to be random.
If anyone can point me to the tab that I can fix my time, I would be grateful
I have never seen a random time axis, so am scratching my head a bit here…
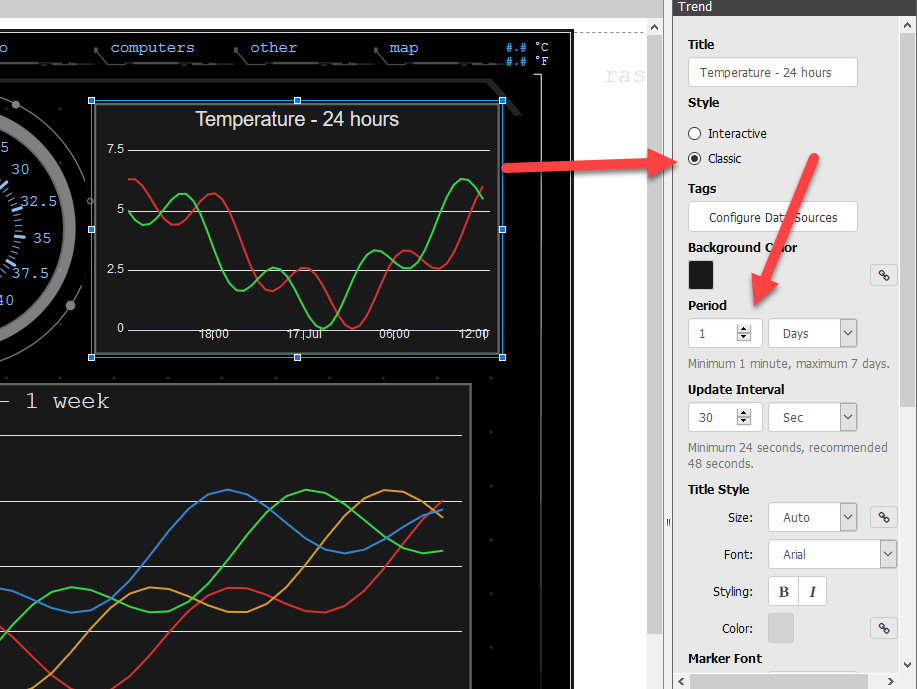
This is the config for a 24 hour trend in my groov build;
You can change the scan rate to match the data granularity you need, it will not affect the overall time axis.
In this case, I am getting the pen data every 30 seconds.
Perhaps you mean the time printed on the axis, and not the axis duration?
If so, we need to know if you have groov Server for Windows, or if you have a groov Box (AR1).
For groov server for Windows, check if your PC is not auto updating by a third party application or swapping between time zones.
If it is a groov Box, log into groov Admin and check the system time tab under the ‘system’ menu option.
Make sure you have it set to your timezone and your time synch is set to once a day.
The duration of my time axis is correct. It’s the time printed on the axis that is troubling me.
I am working on windows 10
Also is there anyway that I can stop sampling on a certain time interval and start over?
For example, I want to stop at 1 am and start over at 5 am.
Thanks
You could try adjusting the length of the trend gadget on your page.
Perhaps it is a bit short and so the gadget is having trouble putting tick marks in the space you have allocated for it.
There is no option to start and stop time on the gadget, it does not make sense to do that on a trend that is over time itself.
In other words, 24 hours is 24 hours, if its from 1am to 1am, or 5am to 5am, its the same amount of time over the same period of time.
You might get the result you are looking for if you move zero into your pen variables at 1am and then move the real values into them at 5am??
Thank you. I will try that