Hi,
I just started with your Pac Project software and I am totally new to this. I have created a strategy in Pac Control along with a short optoscript. I try to run the chart from a screen I created in Pac Display but when I set the chart to “[U]watch[/U]” in PacControl, it always shows a stopped status. I included a loop within the chart and there is nothing I can find that would turn the chart off. Any suggestions?
Thanks,
Andre
Hello Andre,
Welcome to the OptoForums and PAC Project Software! A few questions/suggestions for you. BTW, don’t forget that our support is always FREE! support and they’d be happy to help you too.
Also, we have several tutorial/quick start videos you might check out if you haven’t already, like these three QuickStarts a few down from the top on this page.
If your chart is “stopped,” then that means the chart:
- was never started
- finished running (the "loop" didn't loop for some reason)
- was manually stopped
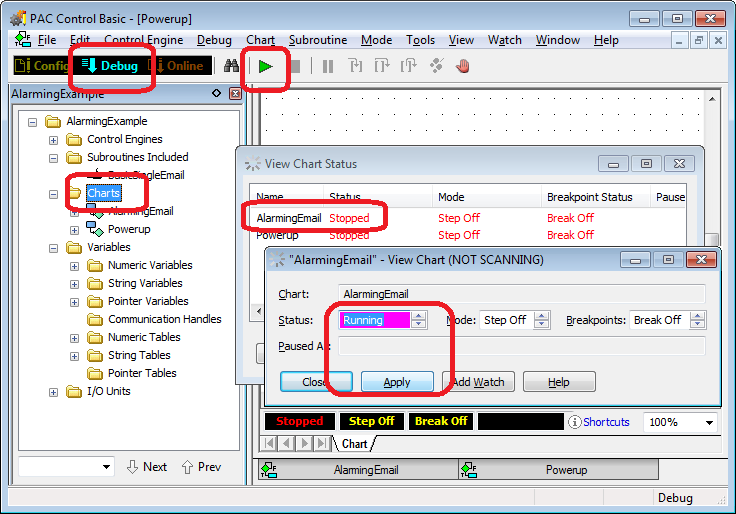
Before you jump into PAC Display, a few things to check out from PAC Control’s Debug mode. As shown in the picture below, verify your “Debug” button is lit in that bright cyan color. To run the strategy initially, you can press the green triangle “Play” button.
If you double-click on the charts folder in your strategy tree, you’ll see this “View Chart Status” window. From there, if you double click on the chart name (such as AlarmingEmail shown here), the “View Chart” dialog pops up. From there you can change the status.
If you change it to “Running” and click Apply, see if it runs (and stays running). If so, then perhaps you chart just needs to be started. For example, with a Start Chart command in the Powerup chart. (Omitting this step is a common mistake.)
Hoping all that gives you a couple of clues. Let us know how it goes!
-OptoMary
Hi OptoMary,
Thanks for your help. I made the assumption that running Pac Display would start the strategy. Looks like I have a lot of work ahead of me but I am very impressed with what I have seen so far. I have a sense that Pac Project was written using Delphi, is that correct?
Andre
Hi Andre,
Actually, most of PAC Project, including the firmware running on the controllers, is written in C++.
I should have mentioned this link before, which includes a variety of self-training tools for those who can’t come to our [URL=“http://www.opto22.com/site/class_details.aspx”]FREE training here in Temecula.
Hope it’s all going well for you!
Sincerely,
-OptoMary