Good Morning,
I am having a problem with the Groov Trending Functions. The Graph initially shows no data even though there is data present in the graph. The Axis for the time is strange as well. I see 2 measurements the x axis.
-
Is there a way to have the graph display some visible data without manually selecting a time period? ( the 1m, 1w or all options)
-
Why do my trends start off with this “dual time” for my x axis?

(Tried to upload a picture and it did not work.)
Can you try sending a screenshot to support@opto22.com? I’m not really understanding it from your description.
-
I do try and show some data at load time. It’s been almost a year since I looked at that last, but I think it tries to show the most zoomed-in data possible when the trend first loads and do live refresh of the data from there.
-
I’m not sure what you mean here.
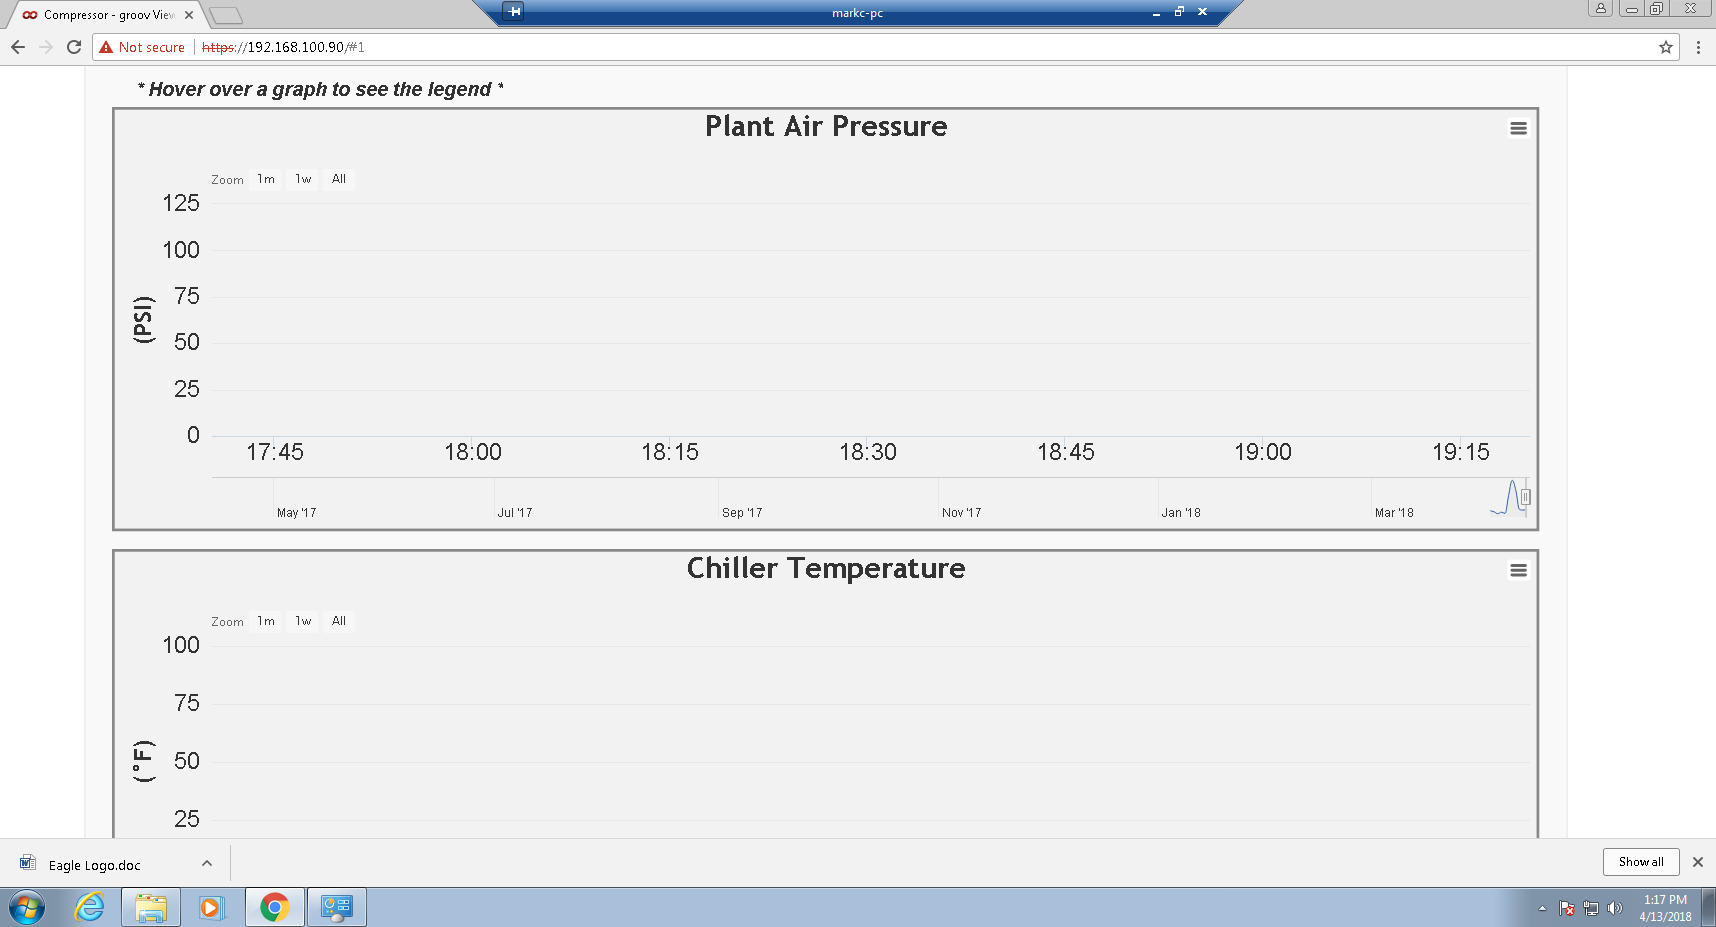
So if you look at this trend there is data in it but it doesn’t show initially. We have to manually move the bar at the lower right part of the trend or we half to click 1m, 1w, all.
I wanted to see why its not innately showing data and why there is a timestamp(?) above the dates on the x axis.
So yeah, #1 is just a bug.
The two timestamps are because the X axis is at a different scale at the time you’re looking at it than the navigator axis. The navigator (should) always show the full range of the trend you’ve configured: it looks like a year in this case? The X axis above it shows the range for the currently selected bit of data: about an hour and a half.
Changing the selection in the navigator will change the values shown on the X axis.
As for why no data is showing: very long range trends are buggier than I’d like, and it’s very hard to zoom in enough to show live data on them.