Hi
Will GROOV 2.0 support Historical Graphing?
Regards,
Milind Raval
Hi
Will GROOV 2.0 support Historical Graphing?
Regards,
Milind Raval
yeah this would be awesome!! +1 from me
nick
Nick and Milind,
2.0a wont, but be sure and subscribe to OptoNews. 
(And don’t forget, PAC Display does Historical graphing and the basic version is free!).
Ben.
If we had a chart tool that would chart the contents of a numerical array we could use strategy logic to populate the array. It would be an easy interim tool for people who are desperate for historical charts on groov (I count myself in that group). A lot of times users just want to see the last 1 hour or 1 day of data, and it would be easy to have Opto keep an array populated with the most recent data…
Interesting idea.
If you had logic to put your historical data in a numeric array/table (which is easy, as you say), and you just wanted a dozen or couple dozen of the last values… you could leverage the “vertical” option on the Range Indicator gadget, perhaps something like this:
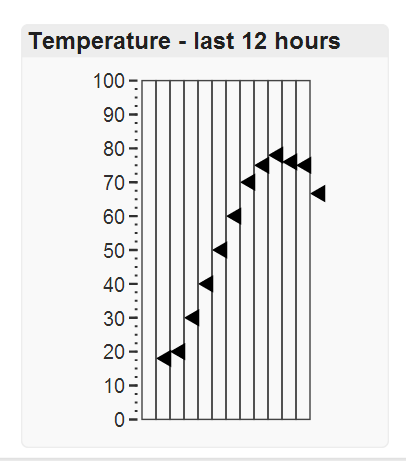
Perhaps that could work for the “most recent” or “one day” of data you mentioned?
great. this will help.
Thanks.
Regards,
Milind Raval
Now that more gadgets have a “vertical” option (as of groov 2.1), you have more options for graphing. Here’s an example using the “level indicator” gadget:
-OptoMary
Some big improvements to the plot/trend gadget, coming soon in 2.2. No more work-around needed!
Love the new trending! I had to post that somewhere…thanks guys 
