In these posts about totalizing (both analog & http://www.opto22.com/community/showthread.php?t=1346 and digital http://www.opto22.com/community/showthread.php?t=1360) values), we talked about getting running totals of various measurements. But what’s the next step in turning your data into something helpful?
You have various options for logging and putting info into databases, but what if you just want some visibility into usage for this week, month, or year? Maybe even how this year’s usage compares to previous years?
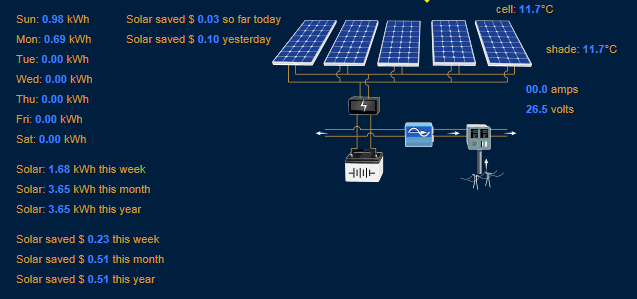
The groovFan mentioned in this analog totalize example wanted to show his daily total on 7-day (1-week) calendar, and up to 31 daily totals for the current month. Those daily totals would also be summed so he could see the monthly totals. Those three lists of 7, 31, and 12 totals would each get cleared out at the end of the week, month, and year, respectively.
Additionally, we wanted totals for each year (also updated daily) in a, for example, persistent 200-element list – where first element represented 2000, and element [15] would be 2015.
He’d written some code that ran just after the clock rolled over at midnight, but it wasn’t working quite right – he was off by one here and there – so he asked me for a little logic/coding help. The basic summing, etc. logic wasn’t too exciting, but this real-world example touched on several of my favorite topics:
- Why/when to use OptoScript (vs. flow charts), and [B]subroutines[/B] (vs. copy/paste)
- The importance of [B]good variable names[/B]
- [B]Sanity checking[/B] (your floats and your assumptions)
- [B]Testing[/B] (to make sure what you meant is what you coded)
SUBROUTINES
He wanted to have a similar dashboard/summary for not just his power production, but also for his water usage, and a few other values he’s not yet connected to his system.
Perfect place for a SUBROUTINE (BTW, some of the “downsides” to subs mentioned in that http://www.opto22.com/community/showthread.php?t=696 sub 101 post will be going away in an upcoming release of PAC Control. If you’re already a subroutine fan, make sure you’re Keep me informed about Opto 22 products with OptoNews subscribed to OptoNews www.opto22.com/community/showthread.php?t=696 for more info.)
This particular OptoFan likes to name his variables differently that how I like to name mine. An added benefit of a sub is that when you import someone else’s sub into your strategy, the variables are local therefore not contaminating your lovely naming scheme with whatever lovely naming scheme they favor. The sub is a black box that way.
GOOD VARIABLE NAMES
Whatever your favorite naming scheme, don’t forget you have up to 50 characters, so increase your odds of success by including units in those names, if appropriate, and giving yourself clues and reminders. For example, in this subroutine, the list of annual sums is going to start at 2000 by convention. So I called my local variable for that table: ftYearlyTotalsElement0IsYear2000 to remind myself of that convention.
SANITY CHECKING
Like I mentioned in previous totalizing posts, be watchful for invalid floats. If you get a nan (“not a number”) in your readings (for example, if your power supply is low), you could accidentally wipe out a year’s worth of data, for example, by adding it to a previously perfectly good total. PAC Control’s command/condition: “Float Valid?” makes it easy to check, and the Error Handling Commands, for example my favorite: “Add Message to Queue” will put warnings and/or errors in the message queue if you do find something amiss.
TESTING
I ended up writing almost as much code to TEST my subroutine as the sub includes itself… especially since I planned to share this code and use it in multiple places. Also, some of this code won’t get used until a whole year went by, and I’d hate to accidentally lose that much data. So the test code fakes out some date values so I could watch and make sure the sub worked how I expected for a year and then some.
Here’s the guts (where we actually totalize, notice most of this code is sanity checking):
  if ( IsFloatValid( fYesterdaysTotal ) ) then // it's okay to add to all our other totals, it won't clobber (turn to qnan) those out too
    // we're all good, no need to make any changes to that total
    fSanityCheckedTotalForYesterday = fYesterdaysTotal;
  else

    NumberToString(nMonthToUpdate, sValue_A);
    NumberToString(nDOM_to_update, sValue_B);
    NumberToString(nYearToUpdate, sValue_C);

    sErrorMessage = "Invalid float on: Month: " + sValue_A + ", Day: " + sValue_B + ", Year: " + sValue_C +
      " Discarding bad value (will add 0 instead).";

    // put a warning in the queue
    AddMessageToQueue(16, sErrorMessage);

    fSanityCheckedTotalForYesterday = 0;

  endif

  if (nDOW_to_update == 0) then // we're starting a new week (values: 0 - 6), clear out the old numbers
    MoveToNumTableElements(0, 0, -1, ftWeeklyUse7Totals);
  endif
  ftWeeklyUse7Totals[nDOW_to_update] = fSanityCheckedTotalForYesterday; // update the total in our weekly tally

  // We're starting a new month, then clear out the old month before updating this 1st day
  if (nDOM_to_update == 1) then
    // Ok, now that we have added up the whole month, clear it. This way we dont have to keep track of 29 day years.
    MoveToNumTableElements(0, 0, -1, ftMonthlyUse31Totals);
  endif
  ftMonthlyUse31Totals[nDOM_to_update] = fSanityCheckedTotalForYesterday; // update the total in our monthly tally

  if (nMonthToUpdate == 1) then // starting a new year, clear out our 12-month list
    MoveToNumTableElements(0, 0, -1, ft12ElementMonthTotals);
  endif

  fMonthSoFar = 0.0; // initialize from zero so we don't get confused
  for nDOMIndex = 1 to 31 step 1 // extra days will have zero in them since we wipe out the whole month once we're done with this total
    fMonthSoFar = fMonthSoFar + ftMonthlyUse31Totals[nDOMIndex];
  next
  ft12ElementMonthTotals[nMonthToUpdate] = fMonthSoFar;

  // no need to clear out elements here, since we're keeping them indefinitely, assuming the element # is the year to update - 2000, so [0] is y2k
  fYearSoFar = 0.0; // intialize year for zero
  for nMonthIndex = 1 to 12 step 1 // this time we're counting up all the months
    fYearSoFar = fYearSoFar + ft12ElementMonthTotals[nMonthIndex];
  next

  ftYearlyTotalsElement0IsYear2000[ nYearToUpdate - 2000 ] = fYearSoFar;
endif
Note there near the bottom, to “totalize” all the days of the month, then all the months for the year, I use a “for” loop for each. You could do this in action blocks, but much easier it OptoScript! Also note I did NOT use a for loop for setting the tables to 0 at the start of each week, month, etc. Instead I used the handy MoveToNumTableElement command and passed the shorthand -1 for “do the whole table.” Super fast/easy!
Here’s the full sub in 9.1 basic, including a (detached) OptoScript block which I used a for testing/making time pass quickly (for testing purposes only, not recommended in Real Life).
Happy summing!
-OptoMary
9.1BasicSubroutineToUpdateWeeklyMonthlyYearlyTotals.zip (4.51 KB)