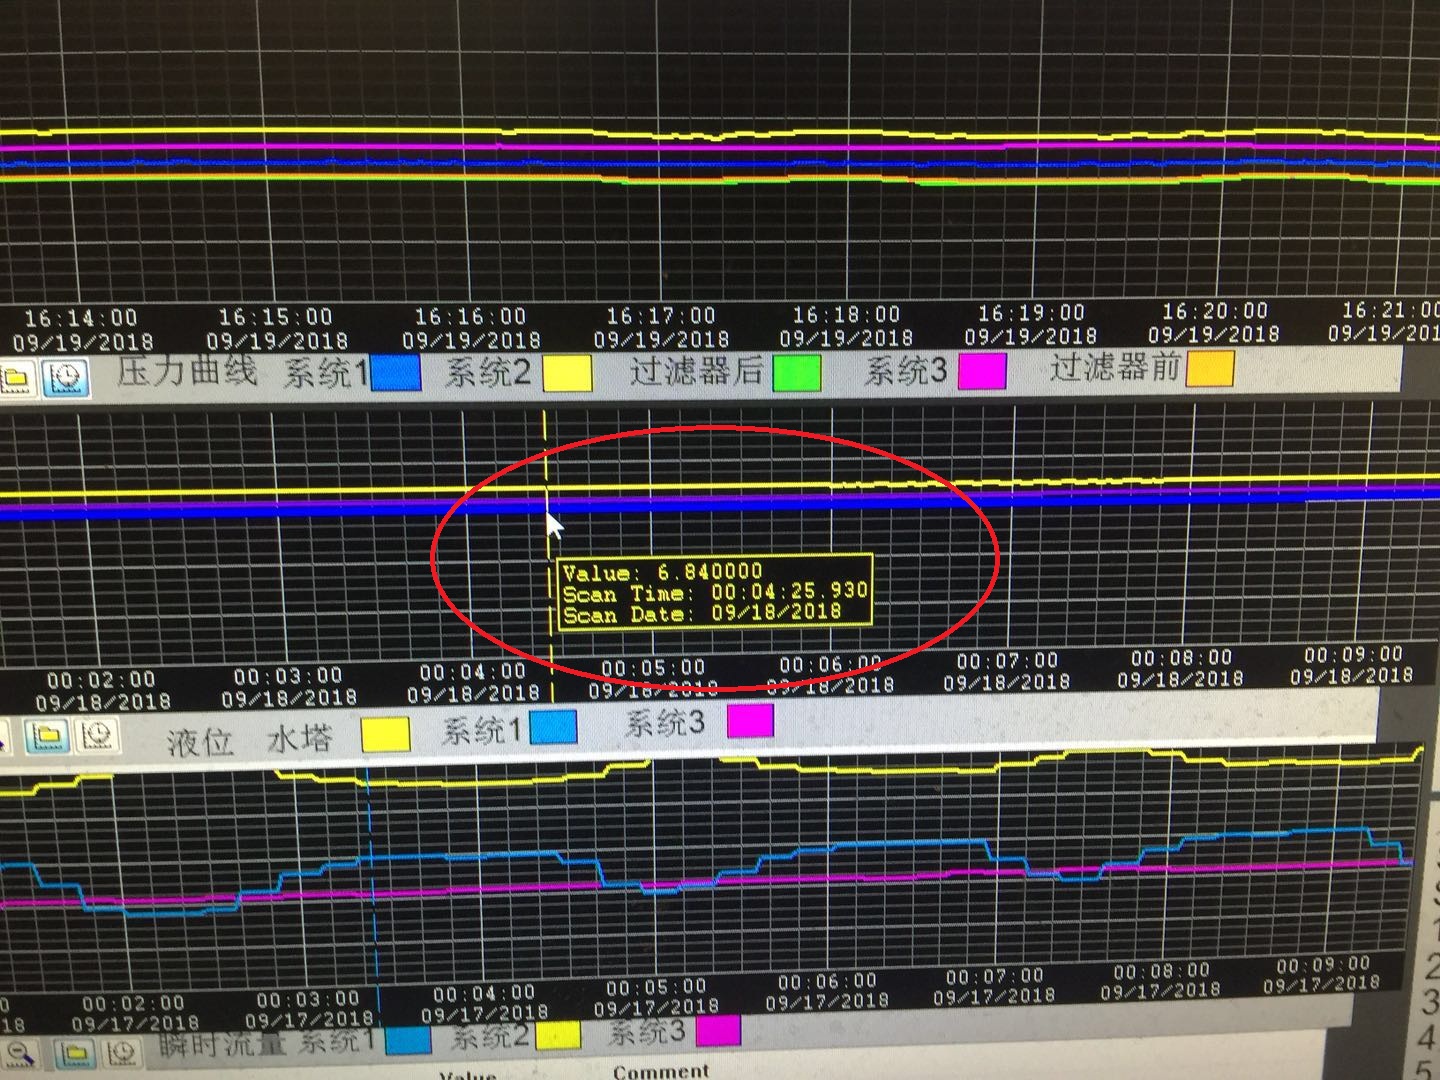
Why can we only show the details of this yellow curve?
Did I do it wrong?
What should I do to show the detailed data of a certain point on a curve?
Sorry, there is another problem.
In a Chart of R1, which command should be used to determine whether an I/O Unit (e.g. EB1) is powered down or disconnected? Use “I/O Unit Ready?” or “Error on I/O Unit?”
Which command should be used to restore communication between R1 and EB1?
Thank you!