Chart & Pressure OptoScript Coding

Hello Everyone

Can you take a look at this chart and tell if I’m doing it right?
When the chart starts, I need the PAC to sense if the “AP Box” is attach to the machine. If it is not(False), then the chart will stop running. If (True), then it need to know if there is solution in the “AP Box”, and that will be an input(the operator will “check” a box yes or no) in the program before the process starts.
If there’s no solution(False), the AP Heater will turn on to a set temp. (setpoint). If (True), the system will wait till it get to a pressure set point, then turn on the AP Heater. I want it to only spend 30mins trying to get to the pressure set point b/c if there’s a pressure leak somewhere, it will be wasting time.

I am a beginner when it come to coding. So in my AP Pressure OptoScript box, I’m trying to write a code so that, if there is AP solution. The process of burning the solution starts when the pressure SetPoint(15mTorr) is met and then the AP Temperature will rise to 180C. It will maintain the temperature till all the solution is is burnt off, this subsequently raise the pressure and that okay, b/c of the solution that is now turned into a gas. I also need the system to constantly try to get to the pressure setpoint (15mTorr).

When all the solution is burnt off, the system pressure will return to the setpoint of 15mTorr. I want the AP Heater to keep heated(On) till the whole process is done.

I understand if coding help could not be provided.

Thank you

Duy

Did you intend to attach a chart, or screenshots of one? I don’t see anything other than your description of the intended function.

wow sorry that slip my mind…

The bottom part, is where I have no clue how to go about it. Once the Pump pressure reaches 15mTorr (set point), I need the AP Heater to turn on and heats up to AP temperature set point. It will maintain the AP temperature set point. As the temp. goes up, the solution is being vaporize, which in turn increase the pressure.
So this whole time, the system keeps trying to pump the pressure down to the set point. Once the pressure reaches set point again, then we know that all the solutions is gone. But we still want the AP heater to still be on, so that nothing will get stuck to it.

Hope this makes sense now.

Thank you

Hi Duy,

If you want, you could attach your exported chart. Just right-click on the chart that puzzles you and click export and zip/attach the .cxf file.

It’s hard to see your image here. But I do see that you have that one OptoScript block off to the left there, not attached (and therefore will never run). Also keep in mind that any logic in your flowchart that you do in the blue & green Action & Condition blocks can also be done in OptoScript. But you don’t have to use OptoScript, ever, if you don’t want. Because the opposite is true too: anything you can do in OptoScript can also be done in just Action & Condition blocks (which are sometimes easier for people, especially those not fond of programming).

In any case, just looking at how your have your Action and Condition blocks attached, it looks like this chart does the following (which could be running at the same time as the many other charts I see picture):[INDENT]

  1. Loop forever until that first condition is met. The way it’s currently laid out, you’ll never go back to that part where you’re checking that condition, unless you re-start this chart again somewhere else.

  2. Once that first condition is met, the next condition is checked. If that condition is F (I think that’s an F, going of to the right), you’ll do whatever is in that block, and this this chart is done running. (Because there’s no line coming out of the chart.)

Otherwise, if that second condition is True, you’ll loop around doing something, checking something, doing something else in that bottom block, repeat over and over forever until that 3rd condition is true, in which case you run that block to the right and you’re done.
[/INDENT]

I’m not completely clear on what you MEANT for it to do, but it sounds like you have the following inputs/outputs (listing these is always a good place to start):

[INDENT]1) Pump pressure Setpoint - input, probably a Variable (Numeric, Float; always 15.0?)
2) AP Box sensor - digital input? how do you sense if it’s present?)
3) Pressure - analog input? (wired to a sensor?)
4) Heater - digital output? (TPO? Analog output? )
5) User input (Numeric Variable like an Int32, tied to your PAC Display HMI screen, perhaps?)
[/INDENT]

Having a clear idea of what signals/values are coming into the system and going out will be a good first step in sorting out what your logic should look like.

Next you can ask yourself, when would we want to, for example, turn on the header? (I think that’s the only output you’re actually “controlling” in this case, yes?)

I hope that helps! Let us know…

-OptoMary

Hi Mary

I have attached the chart that I have been trying to post yesterday. Hope you could get a clear picture this time of what I’m trying to do. Also thank you for your help so far.

Duy

Hi Duy,

Okay, looking at the attached chart, first off you don’t need to start and stop the chart in itself. Another chart needs to start it (typically the Powerup chart, which is the ONLY one that is started initially, on Powerup).

In fact, if you do have the chart stop itself like I see in Block 2, there’s no point in having a line coming out of that block because the chart will be stopping and not going there, ever. If you’re familiar with other programming languages, it’s like have more code after a goto or an End – never gonna get there.

See Chapter 4 (and the rest of that manual) I mentioned above on Designing your Strategy… which also talks about listing your Inputs and Outputs.

So, now kinda doing your homework for you a little here, listing Inputs and Outputs we have:

Inputs/Outputs:[INDENT]
2 physical analog inputs: Pump_Pressure (currently referenced in blocks 52 & 10, compared to the literal 15 in that bottom condition blow); Chamber_Pressure (also compared to 15 in your floating/used OptoScript block 33)

diAP_Heater - digital input, to tell if this whole “AP thing” is there, I presume

bStartFlag - looks like the input from your user, but you use this variable elsewhere, when you’re reading your Max Pump_Pressure? I don’t think you meant to do that…

doAP_Heater - digital output, which I presume is the only thing we’re actually controlling here.
[/INDENT]

I’d suggest changing that 15, currently hard-coded into your chart in 2 places, into a Numeric Variable, perhaps called: fPressureSetpoint_in_mTorr. Because later you might want to change it (even when your testing, temporarily). And you can’t do a search on “15” in your chart, but you can search for a variable. Also, what if your boss comes by and says: oh, by the way, that 15 should be 25.5… what if you miss one when you go to change it?

Notice the name I gave that float variable (which you’ll start of at 15.0) INCLUDES THE UNITS. Always include the units. (You do know about what happens when you mix up your units like[U][B] NASA scientists did with the Mars space probe[/B][/U], yes? Don’t do that. Learn from their mistakes.) You have 50 characters to name your variables, points, etc. Use them!

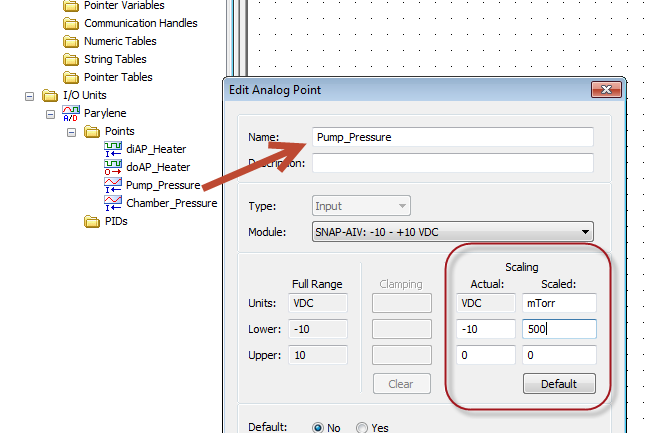
And… I noticed that currently your analog inputs named Pump_Pressure (no units) and Chamber_Pressure (also needs units) are not scaled. Edit those points to include a better name and map your -10 to 10 VDC actual signal to whatever the appropriate scaling is. As you have it now, you’re using the default scaling so neither of those will EVER get to 15 anything since 10 is the max.

Also, in that bottom condition block I noticed your checking to see if your Pump_Pressure is EXACTLY equal to 15. Besides the scaling/range problem, think about the odds of this happening. Usually, even if you have a control system like a perfectly tuned PID loop keeping that value as close to possible to 15, it will only rarely if ever, get to 15.000000000 on the nose exactly (and floating-point comparisons is a whole other topic).

However, I notice in your OptoScript block you had a <= 15 which makes me think you’ve done a little programing, and might prefer to use OptoScript for this whole thing…?

Now, I’m pretty sure you’re only controlling that one output, and you’ll need to turn it on and leave it on under certain conditions, then you turn it off under other conditions. This might be the best way to approach the problem. Under what conditions should it be turned on or off? You also need to know: how often should we check for these conditions? Since you have a user input here, and you don’t want someone to press the button on the screen an have to wait more than about 100 ms, I’d suggest that’s how often you run this chart in a loop. Or more specifically, how long you DELAY before running through all your checks again.

When you first start this chart, should the doAP_Heater be turned off, before you start checking everything else?

Here’s how I think you might want your logic to flow:[INDENT](Right after the Start)

Turn off (doAPHeater)

Check: diAP_Heater present? (consider changing this name too, especially since it’s so similar to the output, perhaps something like: diAP_Box_Present_when_On, including not exactly the units there, but a clue to which way the switch goes).

Check, probably in same condition block, with AND for your Operator, which is the default, condition: bStartFlag <> 0 (Note this is [U][B]better than checking for True since sometimes true is -1 and sometimes it’s 1 but false is always 0[/B][/U]).

Both of those false? Nothing to do, go to that block where you currently Stop the chart and instead Delay for nAPHeaterLoopDelayMS which you can initialize to 100.
[/INDENT]

Is this making sense so far? You’re looping around check if we should be doing something, if nothing to do you Delay 100 ms and check again…

For the next part, explain in detail when the heater should stay Off or Turn on Stay on, and when it should be turned off again. I see you have 2 pressures in here and I’m not clear on the rest of the logic, and hope what I’ve told you so far will get you going…

Here’s a clue, if you know you’re always starting with the heater OFF, then when you do have all the conditions met to turn it ON, you’ll need to start a timer (probably and UpTimer, see those under Numeric Variables) then later check to see if it’s > 30? Or fMaxTimeToHeatBeforeGivingUp_in_Minutes… but since timers are in seconds, maybe you’d want to set that new float to 30 minutes x 60 seconds/minute = …

Also, don’t forget to think about when other stuff needs to be turned off or cleared, like your timer, and the flag coming in from the user…

Go! I’d be happy to check your next pass at this, especially since you’re willing to share w/other newbies out there!

-OptoMary

Hi Mary,

THANK YOU SO MUCH! for your reply, it was so helpful!

I have been going through my chart, fixing and making changes that you have pointed out to me. I also have been reading the users guide (selection 9 “variables”) and learning how to set up the variables part of my chart.
You mention in your response to me about “scaling” and I figured that I need to set up a numeric tables, to input the voltages(volts) and the pressure(mTorr). But my problem is, I can’t seem to find out where to input all the data that I have on a table. On page 220 in the 1700 PAC control users guide, they have examples for float table and it seem like there’s a place where I can input the data.

Also, I know very little about C programming. I’m trying to get as much help as I can with it. I do wish I could know/use more OptoScript.

Duy

Excellent! Our tech writers are awesome and create amazing and helpful manuals, so I’m glad you’re checking them out!

For SCALING, that’s actually a feature/function that’s built in at the I/O Unit level – so you don’t have to worry about doing the math, it’s done for you! All you have to do is configure how the incoming signal (like voltage) corresponds to that value you actually want (like mTorr). Here’s a screen shot so you can see what I mean, I just made up values but you get the idea here:


Neat-o!

BTW, if/when you DO need a table, be sure to check out my [U][B]“Mini Lesson” (at the bottom of this set) all about TABLES[/B][/U]! It even includes videos, pictures, and even some corny jokes! :slight_smile: