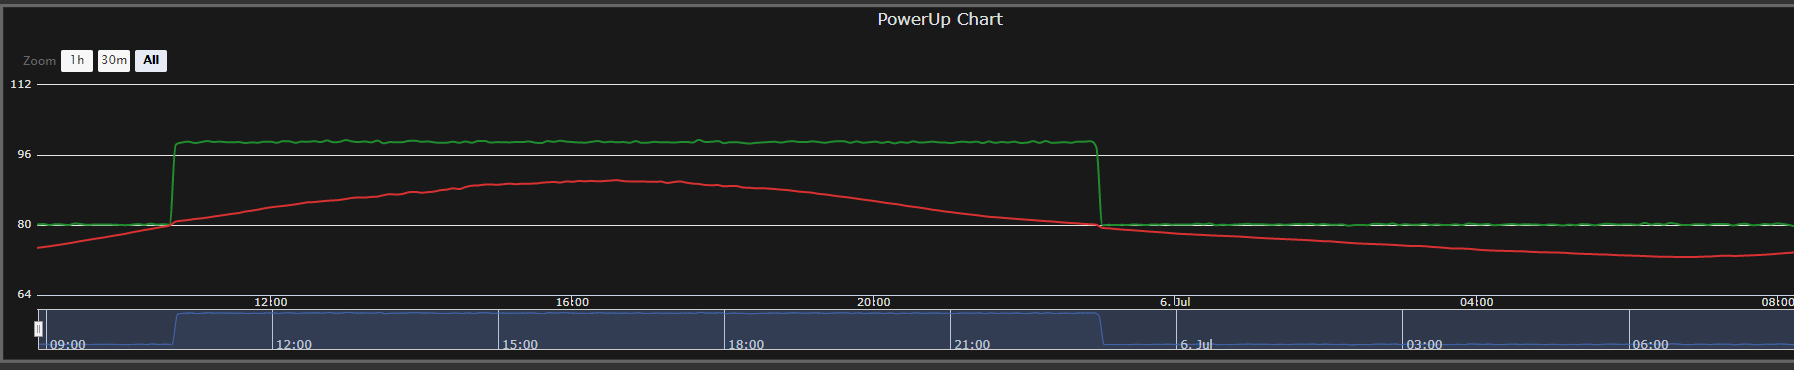
Are these calculations complex enough to cause a significant slow down in the chart? I notice around a 0.25s+ slow down when the temperature rises above 80°F which is when the calculations get more complex. This calculation only occurs once a minute which makes the chart slowdown even more puzzling. I would expect a spike once per minute.
IF (HI <80) THEN
	HI = (0.5 * (T + 61.0 + ((T-68.0) * 1.2) + (RH * 0.094)) + T)/2;
	ELSE
		IF ((IsWithinLimits (T, 80, 112)) and RH < 13) THEN
		HI = (-42.379 + 2.04901523 * T + 10.14333127 * RH - .22475541 * T * RH - .00683783 * T * T - .05481717 * RH * RH + .00122874 * T * T * RH + .00085282 * T * RH * RH - .00000199 * T * T * RH * RH) - ADJUSTMENT1;
		ELSE
			IF ((IsWithinLimits(T, 80, 87)) and RH > 85) THEN
			HI = (-42.379 + 2.04901523 * T + 10.14333127 * RH - .22475541 * T * RH - .00683783 * T * T - .05481717 * RH * RH + .00122874 * T * T * RH + .00085282 * T * RH * RH - .00000199 * T * T * RH * RH) + ADJUSTMENT2;
			  ELSE
			  HI = -42.379 + 2.04901523 * T + 10.14333127 * RH - .22475541 * T * RH - .00683783 * T * T - .05481717 * RH * RH + .00122874 * T * T * RH + .00085282 * T * RH * RH - .00000199 * T * T * RH * RH;
			ENDIF
		ENDIF
ENDIF
Green line is chart time, red line is the temp (Heat Index)
The calculation themselves shouldn’t add much, but if any of those values are IO points, then you are doing a lot more IO reads. If so, you could bring the IO points into variables first and then run the calcs. That should have more consistent performance.
“T” and “RH” are I/O points. So you are suggesting shuffling them to variables and then doing the number crunching on the variables? I’ll give that a shot and see what happens.
The increase in time is not a big deal, but I was curious when I noticed this trend. It never hurts to streamline the code.
Yep, reading from an IO unit can be thousands of times slower than a variable - latency dependent. Also, every time you read from an IO unit, your chart loses the time slice and has to wait to get it again. You are also reading the same tag multiple times in the same line - it will make a separate IO read request for each one (losing the time slice each time), and you may not get the same value (eg. T - T != 0 can happen).