Hi everyone! I’m trying to get PAC configuration to display the steps of my programs as a log I could get back to so I can see at what step my program stopped if something wrong happened, is that possible ?
Hi everyone! I’m trying to get PAC configuration to display the steps of my programs as a log I could get back to so I can see at what step my program stopped if something wrong happened, is that possible ?
May be you don’t know but Pac control debug mode have the auto step and breakpoint tool, you can get into a block, out of it or over by clicking your mouse, super useful.
If this is not what you need then you can use a increasing flag variable after compliting the scrip or blocks commands, simple but not the best because your chart may be fast or if you have a loop that variable will go crazy and will be difficult to find exactly where things got stuck.
Auto step and breakpoint are really helpful – you may also want to check out this little app for PAC Control, perhaps that will do what you need?
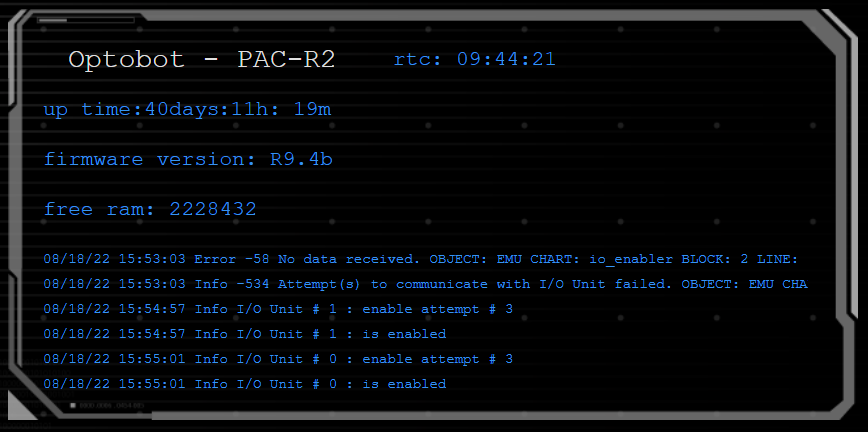
EDIT: This is a groov View screen, not PAC DIsplay, but it’s a good example of what kind of data you can get
I would like to show all the steps on PAC Display runtime, where i can see for example What time the valve opened and wat time it closed, this is only a simple example but i’m mot sure if i can do that on pac Display.
I would like to show all the steps on PAC Display runtime, where i can see for example What time the valve opened and wat time it closed, this is only a simple example but i’m mot sure if i can do that on pac Display. Thank you so much guys for your help
In pac display you can create historical logs triggered by discrete i/o, or you can create time stamps in display using variables and time strings. If you need this to troubleshoot something then you can create an alarm panel which will time stamp the events in colums.
thank you for your help, is there a manual that i could look at to how to set the alarm panel which definitely will help me troubleshoot?
Form 1702, chapter 9, https://www.opto22.com/support/resources-tools/documents/1702_pac_display_users_guide-pdf
Here is a subroutine I use to log events on the controller. It handles Opto 22 errors or you can insert your own text. It puts a date and time stamp in a string table with the last event occurrence at index 0.
Here is how to use it:
deviceName = "(B211) Port Shore Power Swbd - " // This gives the event a unique identifier. B211 is the block it occurred in.
EventSubStatus = EventLog_Insert(0 for user event or 1 for Opto error, Opto Error variable, deviceName, Events);
If it is not an Opto return error then I use a fixed variable set to 0. Events is a string table with a length of 100. Make sure when you create the Event table the string length is long enough for all the text, I set it for 256.
You can display this in the HMI as a table or create an object for each index.
EventLog Insert.zip (10.1 KB)
That’s a groov View screen with a background image and a few text gadgets. to make the list of data.
Its groov View.
Its simply PAC Control tags from a chart that runs every minute or so that collects the data that you would normally see in PAC Terminal or PAC Manger.
Its a chart that is just a collection of controller data… here is an example (about 1/2 down the thread):
OP wanted a way to see what his controller was doing, so @torchard suggested building a chart to log data and display it in groov.
Here is a link to the message logger resource page:
https://www.opto22.com/support/resources-tools/downloads/message_logger_01-zip
I found it in Mary’s old list of greatest hits – lots of good stuff there!