I was wondering if there is anyway to increase the speed of which the data is displayed on groov.
I have a customer who is not satisfied with the speed in which the information is displayed. It takes about 5 seconds to load information on a page. The customer is continually asking “why is this so slow? why does it take so long to display data?”
Any tips or suggestions on how to make data load faster? Is it even possible?
General questions before I can really answer that:
How many pages are in your project?
Roughly how many gadgets on the page are displaying data from the customer’s devices?
What’s the link speed like between the customer’s browser and groov?
Ditto for between groov and the devices?
Is your customer doing anything that would inhibit caching in their browser? (e.g. Incognito mode, etc.)
Large numbers of pages and gadgets take a decent chunk of time to load. My primary test project here currently has 1,452 gadgets on it spread across 82 pages. A quick test on that one here shows about 3.5 seconds to parse all the pages out and do the initial page render, with the first data showing up 1-1.5 seconds later.
Lots of gadgets on a single page displaying data from devices is usually the biggest bottleneck. We batch requests up there in chunks of 20 tags to avoid overloading things, so it can take a bit for all gadgets to start showing data. (There are improvements coming down the pipeline soonish on this, though they won’t be in the next release.)
Link speed always makes a difference, of course. Cellular data will take longer to load, etc. Older phones tend to be noticeably slower than newer ones. (My poor old iPad 2 struggles to even render groov nowadays.)
Browser caching helps out with the application size, though not loading pages. (We don’t cache those.) groov View loads about 1.0MiB of data (mostly JavaScript), so if caching is turned off that’ll contribute to load time as well.
I have the same issues with speed in our Groov app. The first time I tested it I though it wasn’t working because it didn’t respond. I was taking several seconds like you experienced. To be perfectly honest, we’re finding the speed issue to be almost unacceptable, and as a result we’re unwilling to show it to our customer in it’s current state.
The only solution we’re getting from Opto is to reduce the number of gadgets. The Groov UI is limited enough as it is being designed for mobile devices. To ask us as developers to cut back on the number of gadgets and further reduce its functionality is a tough pill to swallow.
Don’t get me wrong. I’m a big fan of the product but you guys need to fix this. We work in the agricultural world where everything is done on tablets and cellular connections, and right now speed is a big big problem for us.
This is a personal groov request as well. Is there anyway to stop the image indicators from showing that “No Image” picture while it’s loading. Multiple customers I’ve dealt with have mentioned that they hate seeing this.
You guys did a great job by removing the “Caution” symbols that used to show up when the data was loading for the LED gadgets.
Speed is however my first concern a multiple customers have asked why it takes so long for pages to load. In comparison I can open up any other webpage and its completely loaded within a second.
I’m currently testing multiple browsers, computers, settings etc. But I would greatly appreciate help on this as well,
@born2see : I’m glad I am not the only one facing these issues. Let’s me know that it’s not just something I’m doing.
I have done 4 groov ar1 boxes. 3 are on cellular modems out in the middle of corn fields and the other 1 is at my home. Accessing the one at home is faster, even though it has the same amount (or very close to it) of tags as the other three. The difference is the connection. The upload speed is the difference. I bet I could call Verizon and ask them to speed up my upload speed (for alot more money per month) at each of the 3 sites and the speed would improve, but I bet my client wouldn’t mind 1-2 seconds as long as he didn’t have to pay more per month. I do not know what the Verizon 4LTE d/l u/l speed is, but at my house it is about 20Mbps d/l and 2Mbps u/l. I would bet the upload speed for the Verizon connections are worse. This is just a thought… I feel sorry for anyone that has old dsl… yikes.
I wonder if the issue is more about latency than bandwidth? Not sure how chatty groov is, but if it is sending a lot of small packets back and forth, I can see how latency would have a large effect on performance.
Oh definitely: over cellular links it’ll be noticeably slower. It’s pretty chatty too: the browser client requests updates from the server every second, the initial load requests something like 20+ separate assets, etc. I’ll need to look into cutting that down.
HTTP/2: I’ve been thinking along the line of websockets for streaming tag data from the server to the browser. Other things like loading all of the CSS/JavaScript/whatnot we need we can solve by just combining those ahead of time.
Does groov compete with I/O? For instance, we have a Snap PAC, an EB1, and a Computer running PAC Display all off one switch. Are they competing to get the information from the same PAC? If so what would you recommend to cut down on the competition?
PAC Display can communicate directly to I/O (like your EB1), to your control engine, or both, depending on how you have it set up, and refresh times for those can vary.
groov usually communicates to your control engine, once per second. However, if you’re using Node-RED or Modbus you might have groov communicating w/your EB1 in other ways which are less common (but not to hard to implement, if you have a good reason for doing it this different way).
Can you tell us more about our concern/what problem you’re trying to solve or avoid?
Our company had a problem with page loading speed when we deployed a groov box at a certain location. The setup had a groov box, a snap pac r1 and a eb1 brain all connected on the same network. At our home office the setup worked well, granted we didnt have an eb1 connected to the pac. When we deployed in the field loading times for the groov pages were upwards of 5 seconds. We are trying to avoid that happening again.
Johnathan, it needs to be way way way quiker then currently.
I get the feeling that for some reason, it is acceptable for Groov to only have a few tags per page while Pac Display can have hundreds per page and be maybe 1000 times faster???
I agree. It takes about 5 seconds for our Groov app to respond as well. The result is the end user clicks or taps again and again thinking the program is not responding, which makes things worse.
I know the Groov speed issue has been brought up quite a few times on this forum. I’m sure that for everyone who takes the time to post, there are several who have the same problem but don’t. They either live with it or move on to another platform. I’ve seen lots of suggestions on how to make it faster but they don’t really help.
What is Opto22’s position on this issue? Are you going to fix it? In today’s world of fast everything, this is really unacceptable.
If anyone has the resources to check, I’d love to see load timings. For example, I have groov running on a VM hosted in New York (we’re in California) specifically to test longer-latency connections. (I should probably move it over to Amsterdam or something eventually.)
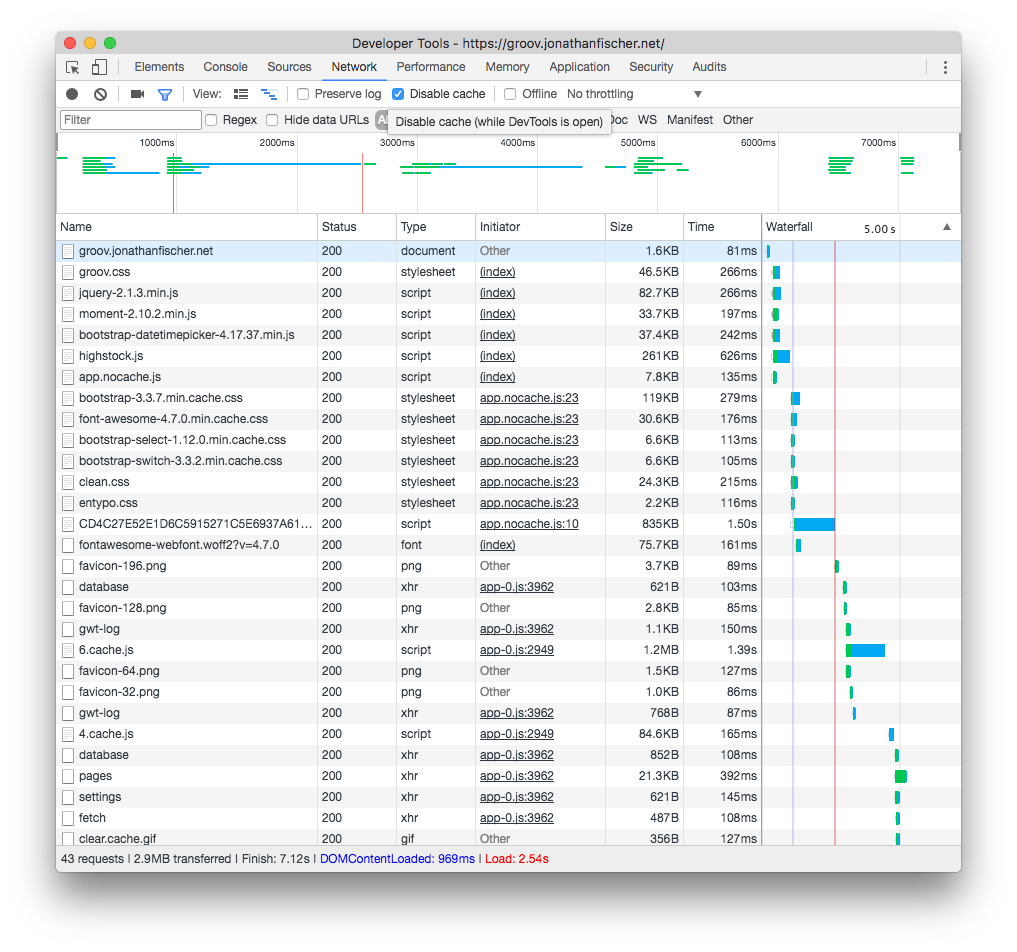
With the cache disabled, it takes 7-10 seconds to fully load and render the first page. Most of that time is dominated by loading groov’s JavaScript (the longer blue lines in this screenshot):
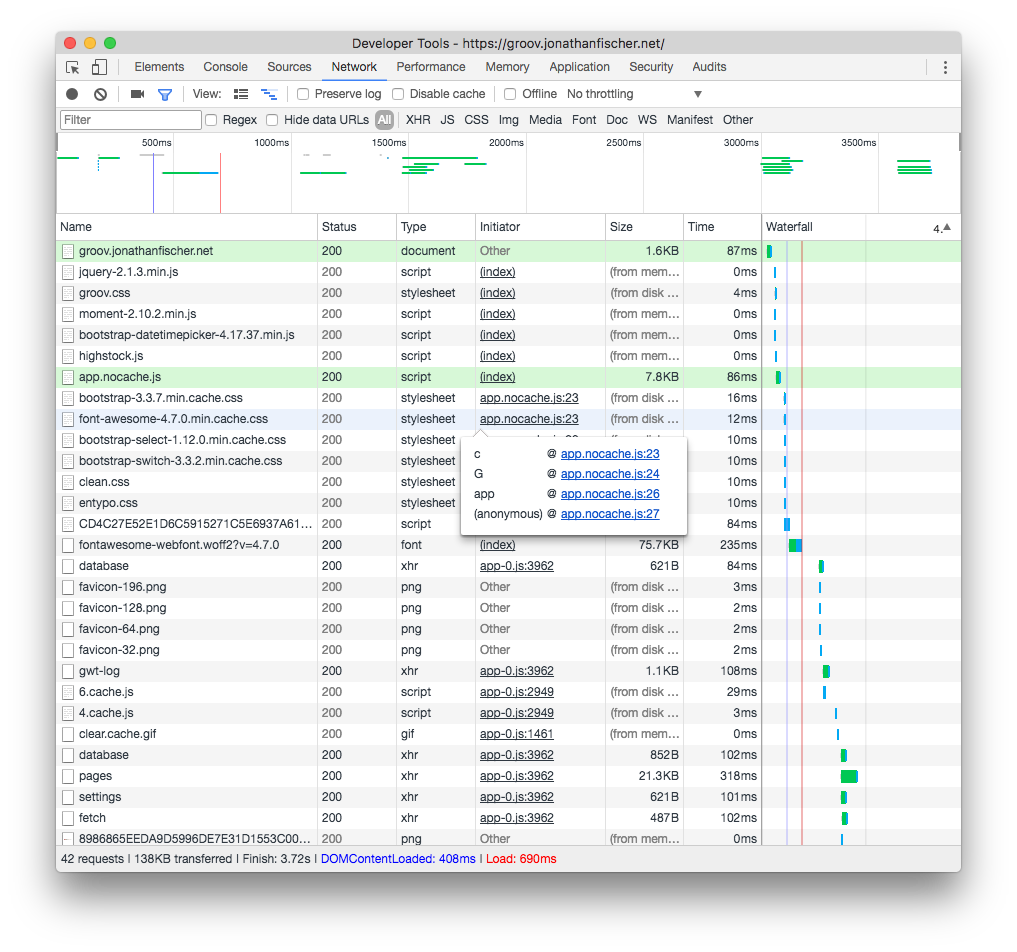
With the cache enabled, I’m down to 3-4 seconds to load the page. The single largest thing that gets loaded is my page definitions: this project has 1,449 gadgets spread across 84 pages, so it’s on the larger side.
There’s not much we can do about the cache-disabled case at the moment: the application is just large to begin with. That said, no one should be running with the cache disabled.
For the cache-enabled case, the biggest hit we take is loading all the pages. I’ve been looking at changing that recently: instead of loading them all at once, I would load the page index (just enough to render the page menu fully) and load the rest of the page definitions on demand. Prototype tests show it helps a lot, but it does mean it takes a bit longer to render a page for the first time.
There are also a few things we can collapse down into a single request: that’s on the roadmap as well.
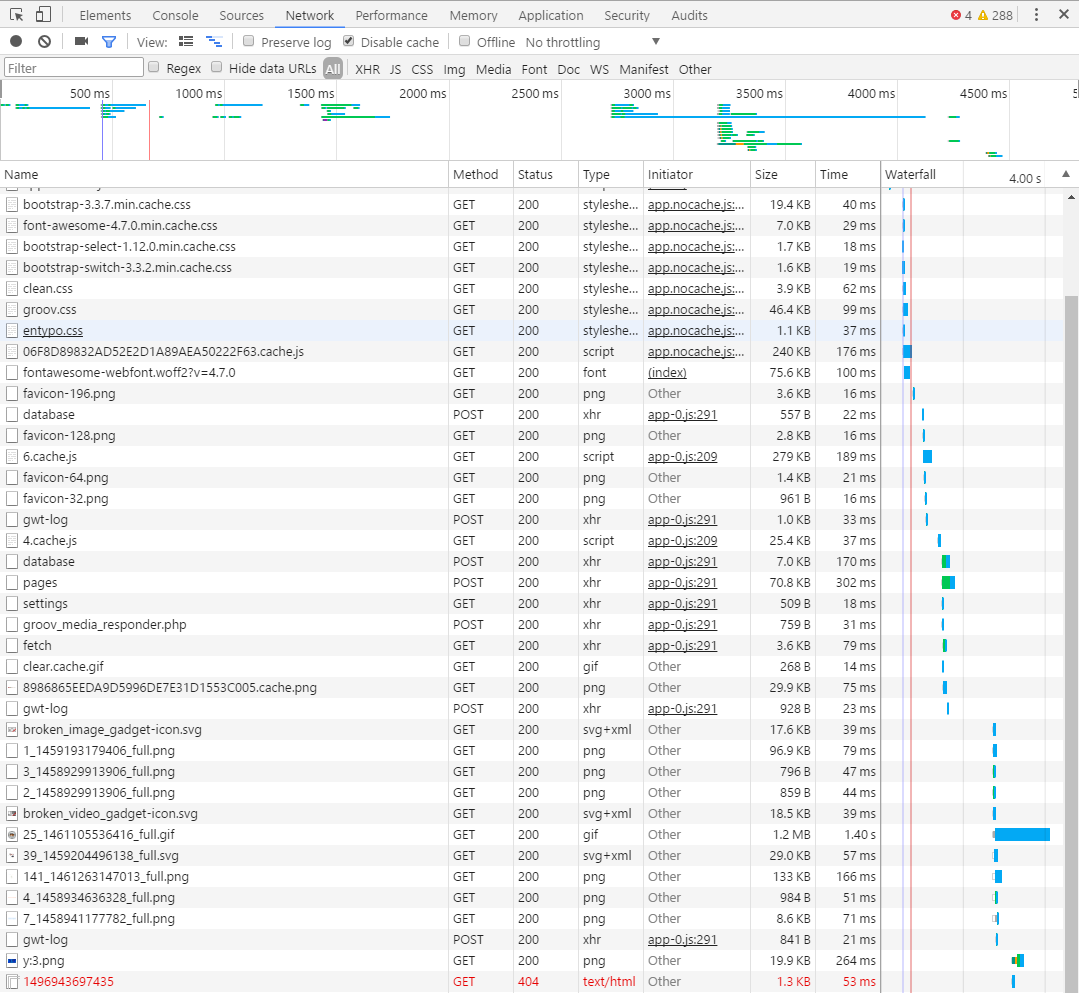
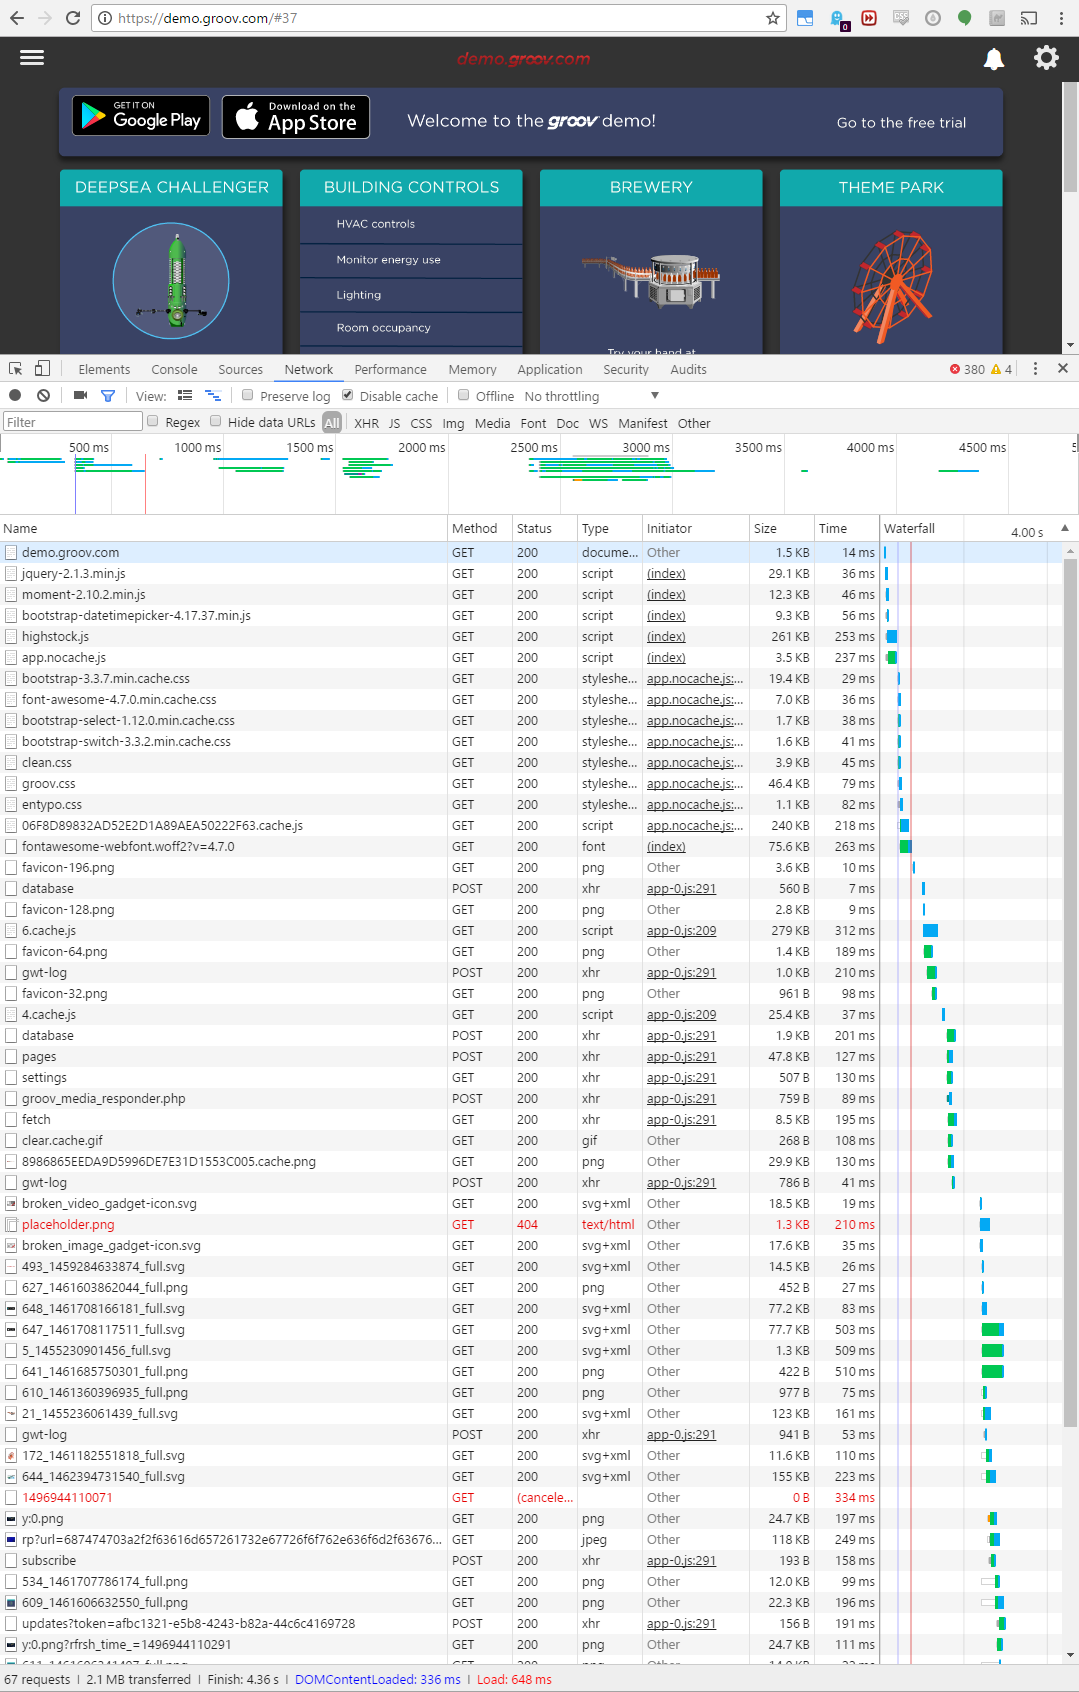
If anyone else wants to record how long it takes to load, open up your browser’s development tools (on Windows, most browsers will pop them open when you press F12), look for something that allows you to record the Network timings, go to your groov instance and log in, then hit Refresh to record how long it takes to load and render. It should be fully rendered when you see a call to the subscribe or fetch endpoints: