Here is my home demo running a groov Box AR1.
Yup. Briefly detailing that first image:
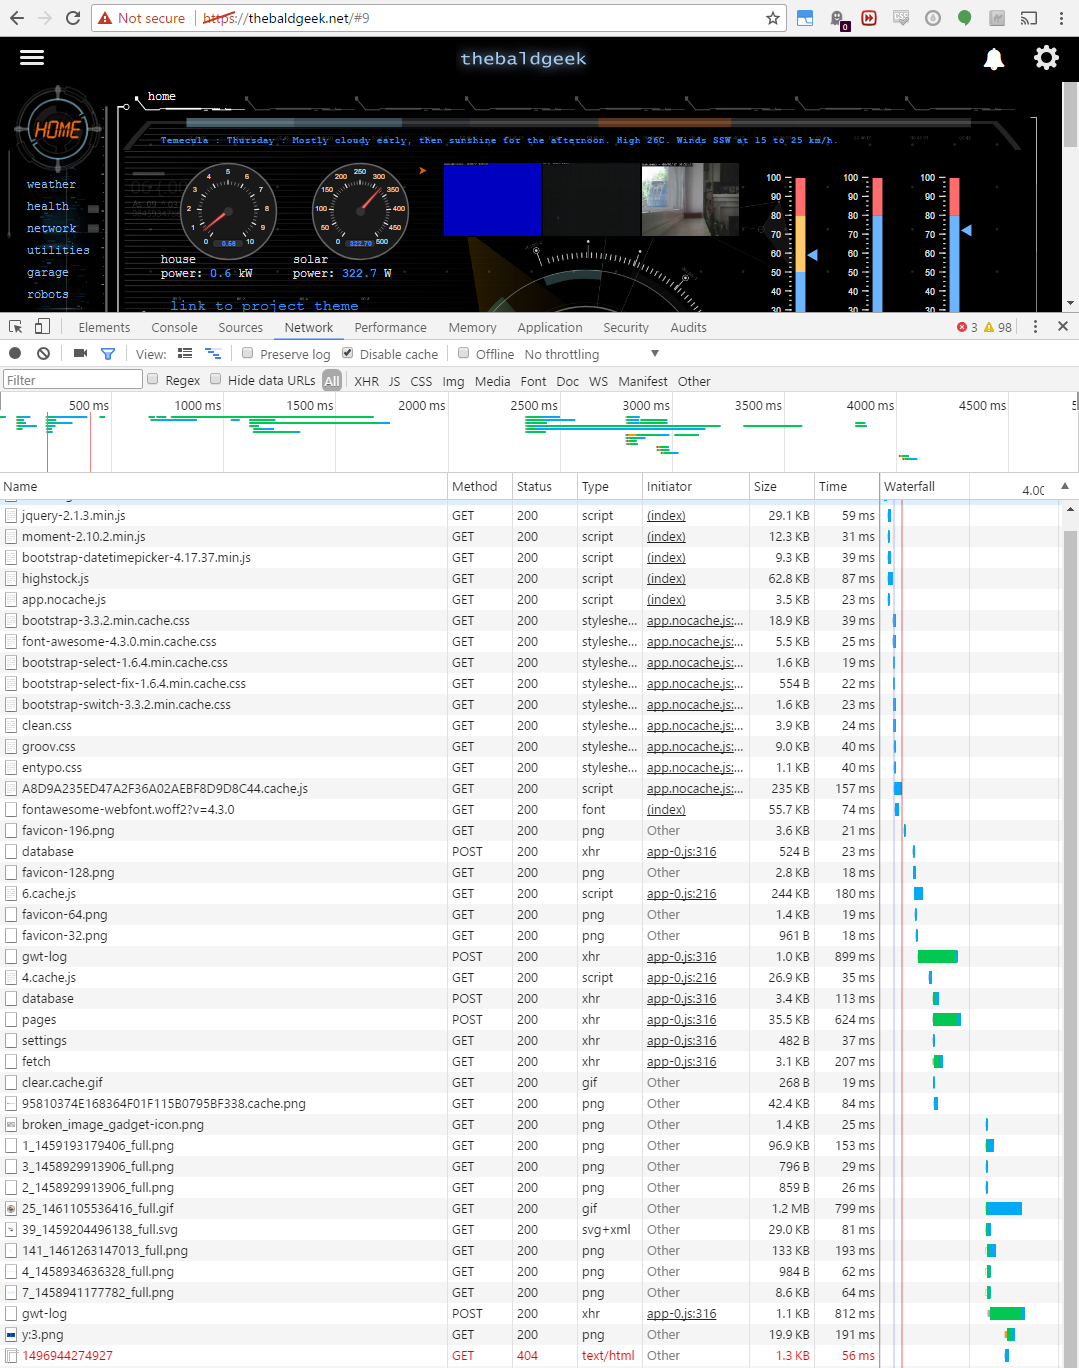
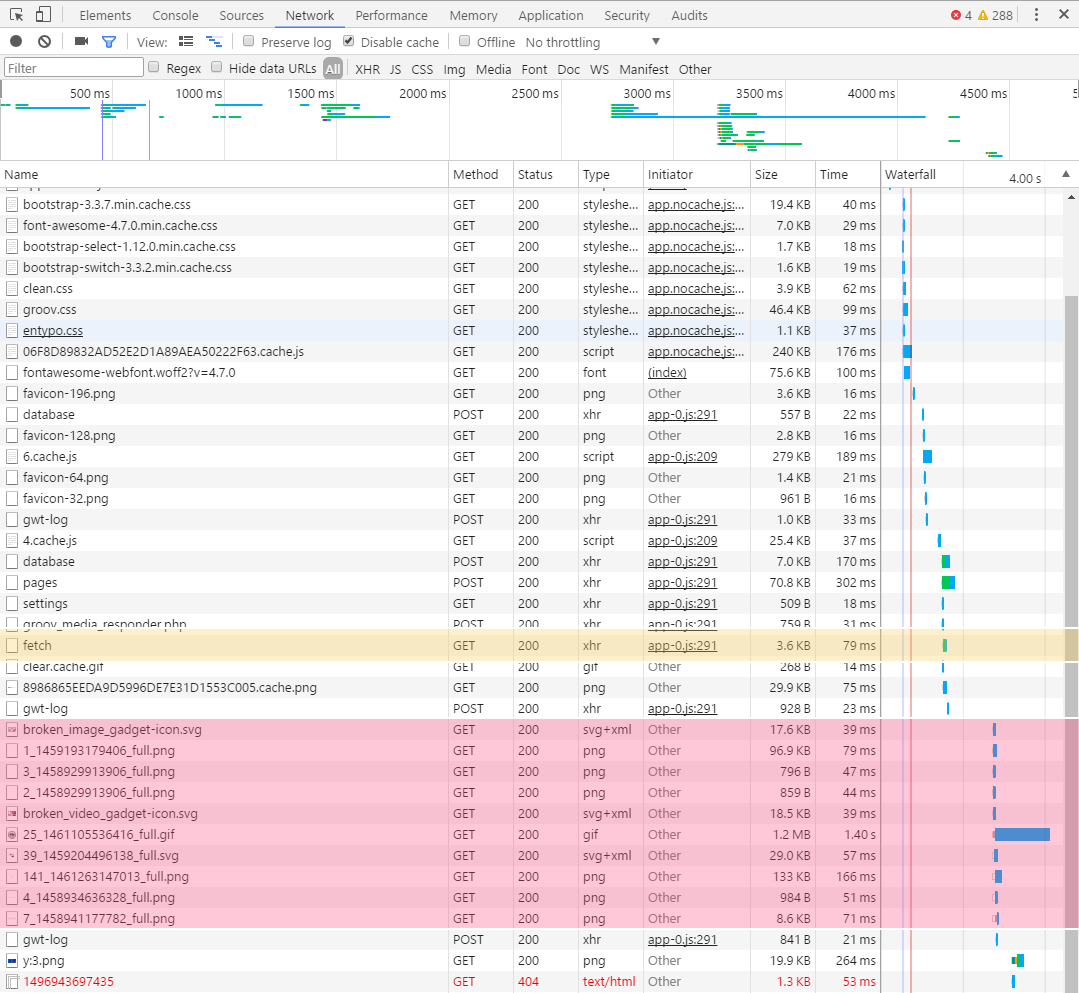
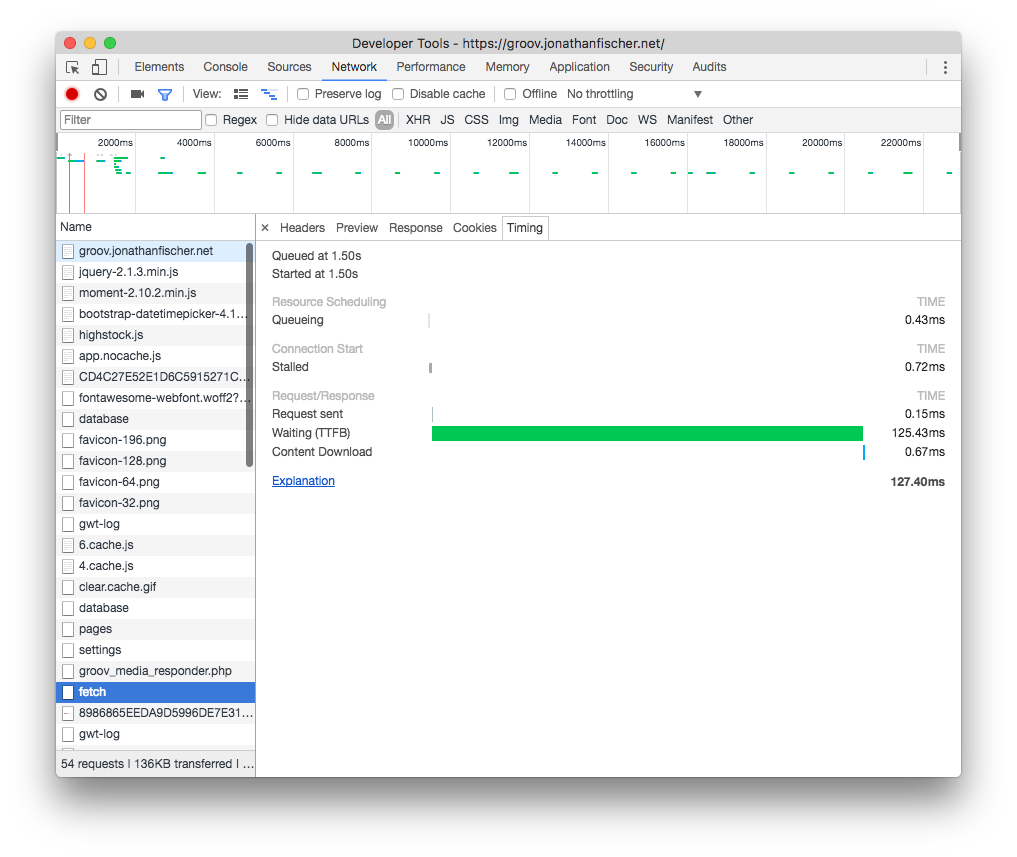
Your page was loaded enough to start requesting tag data at the line with the yellow highlight: that looks like it’s around the 1.5 second mark? You can drill down at get more information if you click on any of the lines and select the Timing tab. For example:
The pink-highlighted lines indicate that you’re using image indicators: we try and pre-load all of the images in an indicate so that there’s no hiccup drawing them later as values change. Those don’t load until the page has rendered though, so it shouldn’t affect the initial load time.
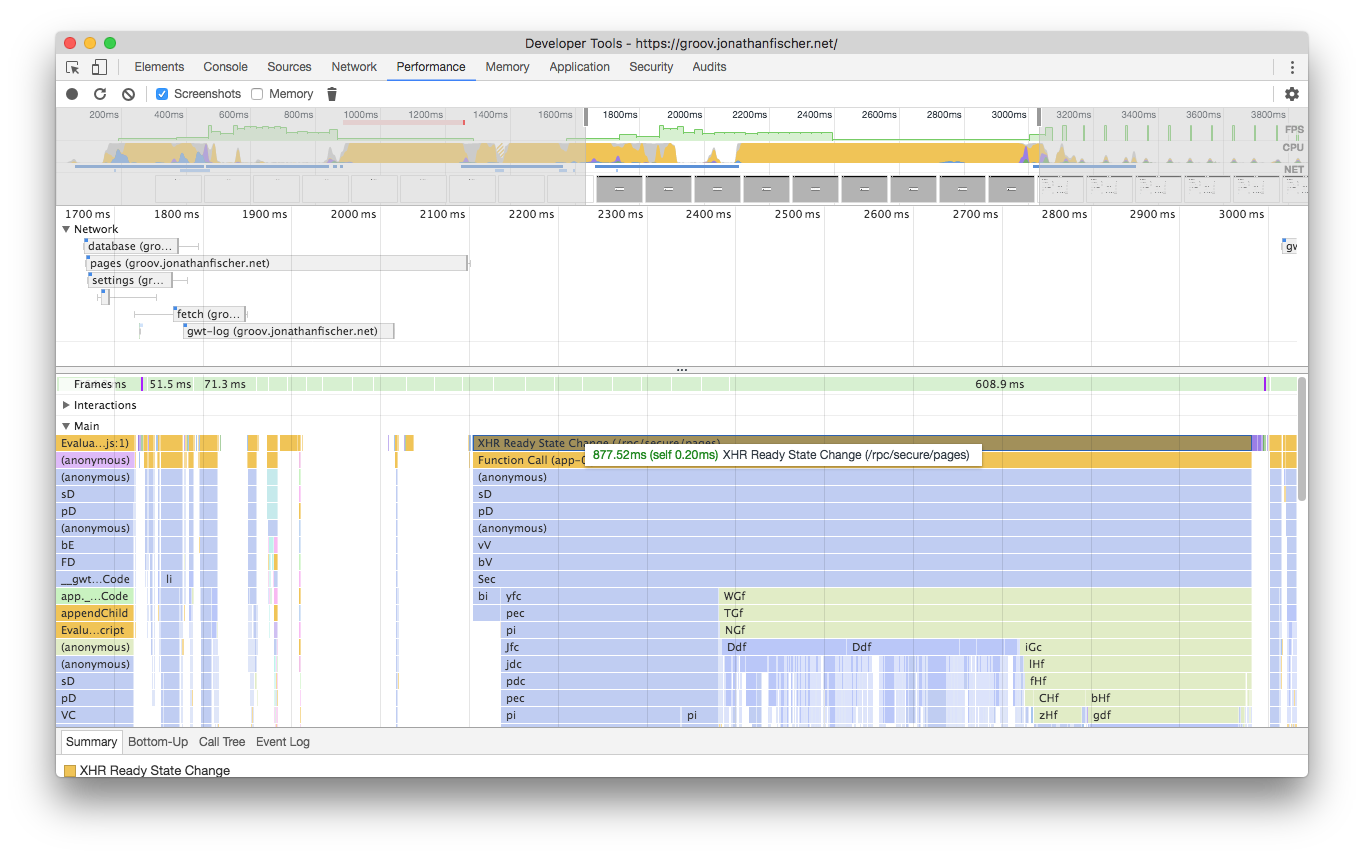
I forgot to mention this, but response parsing time can also have a heavy effect. Again using my New York instance as an example, it takes about 435ms to download the list of pages from the server, but then another 877 ms to parse them all out. (That’s mostly what groov’s doing when it shows “Loading Pages…”.) You can find those details in Chrome’s Performance tab:
All this is to say: yes, we can be faster, and we already know a few places to tackle, we just haven’t gotten the time yet.
Oh, one more thing: for the most part the device serving up your groov instance isn’t a limiting factor for performance. groov’s pretty lightweight, and we try and keep the things that’ll be requested often (like page definitions) in memory so we don’t have to hit the disk on most requests. The limiting factors are usually your connection speed, project size, and client speed.
And they’re all intertwined. The faster the connection the faster you can download your project, and the larger your project the longer it’ll take to download and the longer your client will take to parse the response from the server.
The other two big performance things we’re looking into right now tag subscription set sharing, so we don’t request tag data more than we need to (which would lessen the load on the server and the devices it’s talking to) and pages with heavy gadget overlap: they really bog browsers down.
@born2see @Barrett @nmcdonald @Drenton If you guys could please provide screen shots of your groov load times, that would be really helpful to the groov software team. Thanks.
How would we do that? I see you’re using what looks like the Chrome dev tools but I have no idea how to use those.
Log into your groov page.
Once its all loaded and happy, press F12.
Click the ‘Network’ on the top row of the popup dev tools.
Then click the reload icon on the URL bar and reload the groov page.
Once its all loaded, click the red circle on the top left of the dev tools - this stops the tools from recording all the groov gadget requests (which we don’t want the data for) but leaves the dev tools open.
You might have to scroll back up to the top of your dev tools to see the top part.
From there, use the screen shot tool of your choice. If you don’t have one, click on the Windows icon and start typing ‘snipp’ and click on the snipping tool built into Windows.
Click on New on that small tool bar.
Click and drag the selection tool over the chrome dev tools.
Save the image to your PC.
Come back to the forums, click ‘Reply’, tell us a bit about the box and then drag the image into your post.
Once you are happy with the screen shot, hit F12 to close the dev tools.
Let me know if you have any questions about any of this.
Happy to help.
Hello Opto Team,
I know this is an old thread, but I’m thinking my questions are relevant.
If I create an Groov View Tag called something like “bHideHMI” and when pressed on HMI it toggles visibility on, say, 80% of the screen tags, would that decrease the load on the browser? Or is the browser still doing heavy lifting, even though the gadgets are not visible? This is in an attempt to increase the responsiveness of the HMI (up to 5 seconds before updating after interaction), there are so many gadgets required on our HMI it’s hard to get around removing them.
Alternatively, would you recommend using Groov view as a literal viewer (no buttons) then use PAC Display for writing operator commands?
Thanks,
Dan
I doubt that would help as the tags still have to be displayed. We use thin client PC’s as groov view browsers and completly off load that work from the Epic. Also make sure you are using current firmware as there were some browser changes around V4