Plot a graph from MySQL data

Nice to see this post as the top result of a Google search for ‘graph mysql data’.

Feb 2017 Update.
If you are using a groov AR1, Node-RED is now included and so you can use that to get the data from the PAC into the MySQL database, skipping the PHP insert scripts. (Steps 2-5 in the list below).

Jan 2016 Update

  • jpGraph is still a viable package. It was sold around 2014 / 2015, but still seems to be in active development.
  • groov now has up to a weeks worth of graphing built in so we use that now rather than jpGraph.
  • This method still works as a proof of concept for pushing data into mySQL from a controller. (Just stop at step 6 :slight_smile:
  • You can do the reverse. The OptoScript calls a (different) PHP script. That script does a select on the DB/Table and provides the data back to the Opto controller. I don’t provide the code here to do that, but it’s simply the reverse of this example.

May 2014. Please consider using OptoDataLink to insert controller data into a database.
The method described here is a pretty big hack, its a great proof of concept, but (perhaps) not much more. Please consider using the right tool for the job.

Major (massive) edit one month after the original post;
We have decided that we are going to completely overhaul internetio.com and so all of the code and examples are going to be removed, so I added it here after a lot of editing and cleaning up.

Just like most of the code here in the forums, the following is not officially supported by Opto 22.
It has worked for me on about 15 different computers over the past few years, I even got it working on a Raspberry Pi computer running Wheezy ARM kernel… That said, you will need to be comfortable working command line in Linux to get this working the way I outline here.
Your millage may vary, but, that said, lets know how you get on.

All this started because I was asked by a user how to get a graph showing data from an Opto controller on a web page.
I figured the best way to answer to answer that was to just do a brain dump on the topic.
Its not trivial, but its pretty cool to get all the bits joined together and see your Opto data plot.

The following has been tested with Ubuntu 10.04 server only. It should work on other Ubuntu versions. I cant speak for other flavors of Linux (Im a Debian / Ubuntu guy from way back).

You will need to start with a LAMP install. This is important. Be sure that you have a full LAMP install before you start!

Here is a picture of the process.


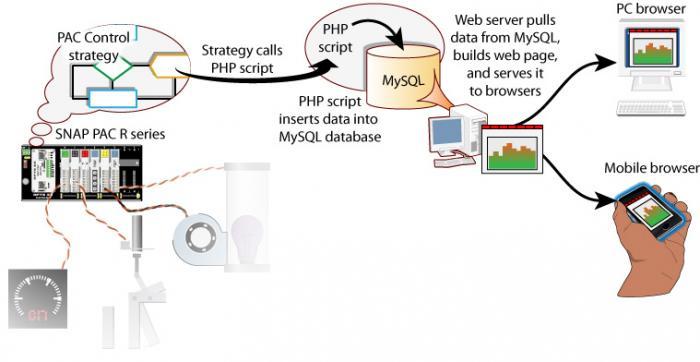
The steps we are going to take are as follows:

  1. Get MySQL set up to take our data.
  2. Make the PHP script that inserts our data into MySQL.
  3. Test the PHP script from a web browser.
  4. Write the OptoScript to call the PHP script.
  5. Check the data is flowing into MySQL from Opto via the PHP script.
  6. Install the graphing package and make the graph.
  7. View the graph on the web.

So, roll up your sleeve’s and here we go!

  1. Setup MySQL. I suggest using phpmyadmin
    From a command line on your Linux box, enter the following:
    sudo apt-get install phpmyadmin
    Log in from your browser:
    http://yourserver.com/phpmyadmin
    User name is usually root and the password is what ever you set up your MySQL to be.
    Create a new user and their password.
    Create a new db.
    Create a new table.
    Be sure and give your user the right to select, insert, update, delete, create and drop on the db.

  2. Make the PHP script to insert the data.
    Create a file in your /var/www that you will call from the optoscript every time you want to insert data.
    Here is the code we used:


 <?php
// Make a MySQL Connection
$con = mysql_connect("localhost","user","pass");
if (!$con)
{
 die('Could not connect: ' . mysql_error());
}
mysql_select_db("optodata",$con);

$value1 = ($_GET['kw']);

mysql_query("INSERT INTO kw (kw) VALUES($value1)");
//two minutes of data (120 points), the extra 7 is for a bit of padding. Probably dont need to cut it so fine.
mysql_query("DELETE FROM kw WHERE timeinsert < (NOW() - INTERVAL 127 SECOND) ");
// not needed, but nice to see the ok come back. You can check for it in optoscript if you like.
echo "ok";
mysql_close($con);
?>  


Note this script does something a little different…
What we found when we just inserted the data is that the db got bigger and bigger (duh), and so what happen is that our graph got slower and slower.
The reason for this is that I could not figure out how to do a partial select of the table data and then build the graph from that from within the graph code.
I had to select the whole table, and then grab the last X entries and build my graph from that.
So the work around we came up with is in the PHP code above, when we do the insert, we kill off the oldest inserted data, this way you end up with a first in, last out db.
A cyclic buffer that does not grow any bigger and always has the newest data at the bottom.
This is important, because if you have the newest data at the top, the graph is backwards.
NOTE: If you are doing the insert for other than jpgraph resons, you will need to tweak this code so you do not lose your data.

  1. Test the script from a browser.
    Fire up your favorite browser (Chrome right?) and tickle the PHP script:
    [B]http://url.com/path/to/dbinsert_kw_1min.php?kw=22.2[/B]
    You should see ‘ok’ come back at you.
    If you check with phpmyadmin, you should see 22.2 with a current time stamp in your db.
    This is just inserting one bit of data, but of course you can insert many many many bits of data.
    Most Linux builds will let you append over 100 bits of data to a URL, so you can really shift some data around using this method.

  2. Write the OptoScript to call the tested and working PHP script.
    Cut, paste and edit the following code in an OptoScript box in PAC Control.
    Download it and debug it.


// Open communications with the web server.
// You need the IP address of the Apache server and what port its listening on.
// "php_mysql_comm_handle" is the name of the communication handle that Opto Control will use.
// By setting it here, we can change it on the fly if we need to talk to more than one database at some stage. (Thinking back up server if the master goes down).
// You could use a URL here rather than a fixed IP address, it could also be a
// remote server over the internet.
SetCommunicationHandleValue("tcp:192.168.1.2:80", php_mysql_comm_handle);  
// consider doing the above in its own block

// This next block of code gets run as often as you want to insert data into the db.
// Be sensible! Once a second is about as quick as you probably want to do it on a local
// server, slower over the web.

// First convert the data you want to send into a string.
FloatToString(femu_true_power, 5, 2, semu_true_power);
//If there is any leading or trailing white space, it will break the URL, so trim them off.
TrimString(semu_true_power, 3);

// build the string we are going to send.
php_sql_url_string = "POST http://url.com/path/to/dbinsert_kw_1min.php?kw=" + semu_true_power;
php_sql_url_string += chr(13); //append CR
php_sql_url_string += chr(10); //append LF

// Send the URL to the other computer.
// (Note, no error checking in ver .01).
 
php_com_result = OpenOutgoingCommunication(php_mysql_comm_handle);
php_com_result = TransmitString(php_sql_url_string, php_mysql_comm_handle);
php_com_result = CloseCommunication(php_mysql_comm_handle);  

  1. Check the OptoScript is working.
    Use phpmyadmin again to check that your data is getting inserted ok.
    Make sure that its limiting itself to the right length table, that its not growing unchecked.

  2. Install the graphing package and make the graph.

First step of this is to install jpgraph.
To do this, download it from the link.
I put it in /var/www/jpgraph.
Unzip it with sudo tar zxvf jpgraph-3.5.0b.tar.bz2
You will need to change the file name if you get a different version.
Once you extract it into a directory with the file version, move it so its easier to deal with;
sudo mv /var/www/jpgraph/jpgraph-3.5.0b1/* /var/www/jpgraph/
Clean things up;
sudo rmdir /var/www/jpgraph/jpgraph-3.5.0b1/

Next you need to get the fonts that jpgraph uses;
sudo apt-get install msttcorefonts
Now you need to tell jpgraph were to find those fonts;
sudo nano /var/www/jpgraph/src/jpg-config.inc.php
Once in that file, change the following line;
// define(‘TTF_DIR’,‘/usr/share/fonts/truetype/’);
into;
define(‘TTF_DIR’,’/usr/share/fonts/truetype/msttcorefonts/');
[Note, just watch the case of the ‘truetype’ here, some installs of Linux have it at ‘TrueType’.
Do a ‘sudo find / -name arialbd.ttf’ to see the path of this important font].

That’s it, you should be up and running. Test it by opening a browser here;
[B]http://yourwebserver.url/jpgraph/src/Examples/testsuit.php[/B]
If you get a bunch of blue error boxes saying something about the function imageantialias not being available in your PHP, try the following gak;
sudo nano /var/www/jpgraph/src/gd_image.inc.php
Search for the function ‘SetAntiAliasing’.
Comment it out like thus;
// JpGraphError::RaiseL(25128);//(‘The function imageantialias() is not available in your PHP installation. Use the GD version that comes with PHP and not the standalone version.’)
Yes. Its an ugly hack. We are just turning off antialiasing in jpgraph.

Once jpgraph is up and running, you should see a bunch of different graphs you can do by looking at that testsuite.php

If you get a lot of blank or broken graphs, try changing the permissions of all the files to 777 to see if that fixes it. On one install I had to change the owner of the /var/www/jpgraph -R to www-data to get it all working.
If you still have trouble, trying making the graph below and un-comment that first line that shows all errors, its been really really helpful in tracking down ‘blank graph’ errors.

Its a pretty cool but very complicated graphing package.
Sadly its not being maintained any more and I while I would love to move to another (far simpler) package, I started out with this thing and so its the one I ‘know’ best.

Now that jpgraph is working, time to build a graph with our data.
Here is some sample jpgraph code to get you started.
Cut and paste this code into a file on your server in your web path.
Something like /var/www/graph.php


<?php
include ("/var/www/jpgraph/jpgraph.php");
include ("/var/www/jpgraph/jpgraph_line.php");
require_once("/var/www/jpgraph/jpgraph_date.php");

//error line below is VERY helpful tracking down blank graph errors.
//error_reporting(E_ALL); ini_set('display_errors', '1');

mysql_connect("localhost", "user", "pass");
mysql_select_db ("optodb");

$datay = array();
$query=("SELECT * FROM opto_power ORDER BY datetimeinserted DESC LIMIT 10080"); //5760 for a day@ 15 second insert rate.
$result=mysql_query($query);
$rowcount = mysql_num_rows($result);
if ($rowcount == 10080){
        // if the DB has enough data to make a complete graph fill array and go
        while($row = mysql_fetch_array($result)) {

                $datay[] = $row['kw'];

        }
}else{
        // if the DB does not have enough data to make a complete graph
        // add what's in DB so far to the array and fill the rest with 0 values
        while($row = mysql_fetch_array($result)){

                $datay[] = $row['kw'];

        }
}

//var_dump($datay);

// Setup the graph
DEFINE('NDATAPOINTS',10080); //5760 for a day@15 second insert rate
DEFINE('SAMPLERATE',60); // Must match insert rate in OptoScript.!! eg. 15 second sample rate for the day graph, every 60 seconds for week. 
$start = time();
$end = $start+NDATAPOINTS*SAMPLERATE;
$xdata = array();
for( $i=0; $i < NDATAPOINTS; ++$i ) {
    $xdata[$i] = $start - $i*SAMPLERATE;
}

$graph = new Graph(640,320);
$graph->SetMargin(40,40,25,80);
$graph->title->Set('Opto Power - 1 week');
$graph->title->SetFont(FF_ARIAL,FS_BOLD,12);

$graph->SetScale("datlin",0,0);
//$graph->xaxis->scale->SetTimeAlign( SECADJ_1 ); // try getting more data than you need to fill the graph to fill the gap at the end.
//$graph->xaxis->scale->ticks->Set(5,10); //un-comment force the time scale.

// Create the line
$p1 = new LinePlot($datay,$xdata);
$p1->SetColor("blue");
$graph->xaxis->SetFont(FF_ARIAL,FS_NORMAL,8);
$graph->yaxis->SetFont(FF_ARIAL,FS_NORMAL,8);
$graph->xaxis->SetLabelAngle(45);
// Set the fill color partly transparent
$p1->SetColor("blue");
$p1->SetFillGradient('red','green');

// Add lineplot to the graph
$graph->Add($p1);

// Output line
$graph->Stroke();

?>


The tricky things are the interval and the time scale across the bottom.
Sorry, but your on your own.
Read the jpgraph docs and look at the samples you saw from running the testsuite.php

If you dont get any graph at all, you should get an error message, use that to guide Google to help you.
Also try commenting out the var_dump and check the data you are getting back from the select statement, perhaps that’s where its choking.

Here is some sample code for a multiline graph with out the fancy select statement.
If you don’t have enough data in the table, you will get an error message.


<?php
include ("/var/www/jpgraph/jpgraph.php");
include ("/var/www/jpgraph/jpgraph_line.php");
mysql_connect("localhost", "user", "pass");
mysql_select_db ("demo1");

$datay = array();
$datay2 = array();
$datay3 = array();
$query=("SELECT * FROM demo1pid");
$result=mysql_query($query);
while($row = mysql_fetch_array($result)) {

$datay[] = $row['temp'];
$datay2[] = $row['sp'];
$datay3[] = $row['fan'];
}

// Setup the graph
$graph = new Graph(300,125);
$graph->SetMargin(40,80,15,12);
$graph->SetMarginColor('white');

$graph->SetScale('intint');
$graph->title->Set('SNAP-PAC-R1 PID Loop');
$graph->title->SetFont(FF_FONT1,FS_BOLD);

$p1 = new LinePlot($datay);
$graph->Add($p1);
$p1->SetWeight(2);
$graph->yaxis->scale->SetAutoMin(70);
//$graph->yaxis->scale->SetAutoMax(100);

$graph->SetYScale(0,'lin');
$p2 = new LinePlot($datay2);
$p2->SetColor('blue');
$graph->AddY(0,$p2);
$graph->ynaxis[0]->SetColor('blue');

$graph->SetYScale(1,'lin',0,100);
$p3 = new LinePlot($datay3);
$p3->SetColor('red');
$graph->AddY(1,$p3);
$p3->SetWeight(2);
$graph->ynaxis[1]->SetColor('red');
$graph->ynaxis[0]->scale->SetAutoMin(70);
//$graph->ynaxis[0]->scale->SetAutoMax(100);

$graph->xaxis->title->Set("time");
$graph->yaxis->title->Set("temp/sp/fan");
$graph->footer->left->Set(' temp=black           sp=blue            fan=red');

// Set the legends for the plots
//$p1->SetLegend("Plot 1");
//$p2->SetLegend("Plot 2");
//$p3->SetLegend("Plot 3");

// Adjust the legend position
//$graph->legend->SetLayout(LEGEND_HOR);
//$graph->legend->Pos(0.4,0.99,"center","bottom");


// Output line
$graph->Stroke();
?>


  1. To test the graph, hit it with a browser:
    http://yourserver.com/graph.php

It should show up instantly.
Bask in its beauty.
Hit F5 to refresh the screen and see the data scroll across the page.

If you want to have it auto refresh in a web page, you will need to learn some javascript and ajax.
Sorry, I dont have any code for that.
Its on the web. Guide you Google shall.

March 2016. Edit. You can put these graphs into groov and have them auto update really simply.
Check out my blog post for how to do this;

Note that in groov you can actually link the Video Gadget straight to the PHP script since it returns a jpg.
I have been using this ‘data to graph’ method for a few years now, groov makes it super simple to display simple sets of MySQL data as a graph and auto updates them as long as you are comfortable with the OptoScript and PHP to make it happen. It seems very stable and reliable.

This is awesome, thank you! I appreciate the tip about the table length. I’m might use some of that code for others projects I have been daydreaming about too.

Here is a more reliable method to keep the table length in check (Using the ‘id’ would sometimes (often) cause the graph to break as the graph select statement would not work because the ID happen to be deleted by the PHP insert script when the graph was being made).


<?php
// Make a MySQL Connection
$con = mysql_connect("localhost","user","pass");
if (!$con)
{
die('Could not connect: ' . mysql_error());
}
mysql_select_db("optodata",$con);

$value1 = ($_GET['kw']);

mysql_query("INSERT INTO kw (kw) VALUES($value1)");
//two minutes of data (120 points), the extra 7 is for a bit of padding. Probably dont need to cut it so fine.
mysql_query("DELETE FROM kw WHERE timeinsert < (NOW() - INTERVAL 127 SECOND) ");
// not needed, but nice to see the ok come back. You can check for it in optoscript if you like.
echo "ok";
mysql_close($con);
?>

Here is the graph that uses the datetime to get the data in the right order.
The other thing this newer code does is fill the graph with zeros if there is not enough data in the db yet… the code above breaks if there is less than the time span of data. This new code fixes that.
(It also fixes the color which jpgraph broke in the new version).


<?php
include ("jpgraph/jpgraph.php");
include ("jpgraph/jpgraph_line.php");
require_once("jpgraph/jpgraph_date.php");

mysql_connect("localhost", "user", "pass");
mysql_select_db ("optodata");

$datay = array();
$query=("SELECT * FROM kw_day ORDER BY timeinserted DESC LIMIT 1440");
$result=mysql_query($query);
$rowcount = mysql_num_rows($result);
if ($rowcount == 1440){
        // if the DB has enough data to make a complete graph fill array and go
        while($row = mysql_fetch_array($result)) {

                $datay[] = $row['kw'];

        }
}else{
        // if the DB does not have enough data to make a complete graph
        // add what's in DB so far to the array and fill the rest with 0 values
        while($row = mysql_fetch_array($result)){

                $datay[] = $row['kw'];

        }
        for($r=1; $r <= (1440-$rowcount); ++$r){
                $datay[] = "0";
        }
}

// Setup the graph
DEFINE('NDATAPOINTS',1440);
DEFINE('SAMPLERATE',60);
$start = time();
$end = $start+NDATAPOINTS*SAMPLERATE;
$xdata = array();
for( $i=0; $i < NDATAPOINTS; ++$i ) {
    $xdata[$i] = $start - $i*SAMPLERATE;
}

$graph = new Graph(304,208);
$graph->SetMargin(40,40,25,50);
$graph->title->Set('Energy use - Last day');
$graph->title->SetFont(FF_ARIAL,FS_BOLD,12);

$graph->SetScale("datlin");
$graph->xaxis->scale->SetTimeAlign( MINADJ_1 );
$graph->xaxis->scale->SetDateFormat('H:i');
$graph->yaxis->scale->SetAutoMin(0);
// Force labels to only be displayed every 5 minutes (5*60)
$graph->xaxis->scale->ticks->Set(5*1440);

// Create the line
$p1 = new LinePlot($datay,$xdata);
$graph->Add($p1);

$graph->xaxis->SetFont(FF_ARIAL,FS_NORMAL,8);
$graph->yaxis->SetFont(FF_ARIAL,FS_NORMAL,8);
$graph->xaxis->SetLabelAngle(45);
// Set the fill color partly transparent
$p1->SetColor("red");
$p1->SetWeight(0);
$p1->SetFillGradient('red','green');

// Add lineplot to the graph
//$graph->Add($p1);

// Output line
$graph->Stroke();

?>


Sorry for the extra updates, but getting this code out and dusting it off caused me to revisit it again and tweak some of the thorns of the previous version.

In the interests of keeping all this in one spot, here is the Opto script I use to call the php script that inserts the data;

This first bit goes in the first block after block 0, ie the first bit of the chart.
Its in its own block because you dont have to do it over and over (like the insert code).
It could go in the same block, it wont hurt to set it over and over again.


// Open communications with the web server.
// You need the IP address of the Apache server and what port its listening on.
// "php_mysql_comm_handle" is the name of the communication handle that Opto Control will use.
// By setting it here, we can change it on the fly if we need to talk to more than one database at some stage. (Thinking back up server if the master goes down).

SetCommunicationHandleValue("tcp:192.168.1.2:80", php_mysql_comm_handle);

In the next block goes the code that does the real work;


//If there are any leading or trailing white space, it will break the URL, so trim them off.
TrimString( semu_true_power, 3 );

// build the string we are going to send.
php_sql_url_string = "POST http://url.com/path/to/dbinsert_kw_1min.php?kw=" + semu_true_power;
php_sql_url_string += chr(13); //append CR
php_sql_url_string += chr(10); //append LF

// Send the URL to the other computer.
// (Note, no error checking in ver .01).
 
php_com_result = OpenOutgoingCommunication(php_mysql_comm_handle);
php_com_result = TransmitString(php_sql_url_string, php_mysql_comm_handle);
php_com_result = CloseCommunication(php_mysql_comm_handle);

Run this code as often as you need to insert the data (hint, probably no faster than once a second, and realistically around once every 5 to 60 seconds is probably the go).

That’s it. This code calls the PHP script shown above which does the insert, the graph then selects the data out and builds the graph for you.

Here is anther type of graph that Nick and I have been messing with…
This graph does not require the jpgraph library, so its a lot quicker and simpler to get up and running. Its also more flexible as to what it will run on since it does not need any libraries.

Sorry, I don’t have an example to link to, but check out the authors page for the graph;
http://smoothiecharts.org/

I’m sure you will agree, its pretty cool.

Nick took that code and made it even cooler by adding two important things.

  1. A time scale along the bottom.
  2. A method to get the data out of MySQL and thus build a selectable historical graph.

This means two things.

  1. Unlike the examples on the smoothiecharts web site, you don’t have to wait for the data to show up.
  2. You can plot any data in your MySQL over time. This means if you have an email alert set, when you get the alert, you can look at this graph and go back and see what was happening before the alert.

So, following the instructions in the first post, get your data into MySQL and once your there, cut and paste the following three bits of code into three files and you should be up and running:

First up, get the data out of MySQL. I called this file smooth.php


<?php
$emureadingstablename = 'OptoEMU_readings'; // the name of the table where the EMU reading are stored
$plotmeasurement = 'kw_input_measurement'; // when graphing, the data to plot on the graph

//To test run this code, call this script from your browser and after .php put ?samples=10 (or whatever you want)
//you should see the data echoed back with pipe delimeters '|'

//get the data from the database
$con = mysql_connect("localhost","user","password") or die (LogError(mysql_error()));
mysql_select_db ("energy_data") or die (LogError(mysql_error()));

//var for the data and the query
$samples=NULL;  //make null so we can die if nothing loaded
$samples=$_GET["samples"];      //use this for the limit of entries to get from the dbase
//die if the samples are null
if ($samples==NULL)
{
        die ("samples is null");
}
$data = array();        //delcare a new array for the data
$query=("SELECT insertid,".$plotmeasurement." FROM ".$emureadingstablename." WHERE ".$plotmeasurement." IS NOT NULL ORDER BY insertid DESC LIMIT " . $samples); //get the data from the dbase

$result=mysql_query($query) or die (LogError(mysql_error()));
while($row = mysql_fetch_array($result)) {
        $data[] = $row[$plotmeasurement];
}
//loop around and create a string with a delimiter
$echodata="";   //clear the string
if ($samples> 1)
{
        //loop around and create a string with a delimeter
        for ($i=0;$i<sizeof($data);$i++)
        {
                $echodata = $echodata . $data[$i] . "|";
        }

}
else
{
        $echodata = $data[0];   //just echo the one piece of data
}
echo $echodata;

?>

Test this code just like as per in the comments at the top of the file.
Run it from your browser and you should see the data come back from your MySQL.
Debug it till it works, don’t bother going on until you see your data!

Once you have that running, put the core code into a file.
We called it smoothie.js
NOTE! Its javascript, NOT PHP.
Also note, as I said Nick changed the js from the smoothicharts site. So you have to use this code below if you want the time scale and histroy feature.


// MIT License:
//
// Copyright (c) 2010-2011, Joe Walnes
//
// Permission is hereby granted, free of charge, to any person obtaining a copy
// of this software and associated documentation files (the "Software"), to deal
// in the Software without restriction, including without limitation the rights
// to use, copy, modify, merge, publish, distribute, sublicense, and/or sell
// copies of the Software, and to permit persons to whom the Software is
// furnished to do so, subject to the following conditions:
//
// The above copyright notice and this permission notice shall be included in
// all copies or substantial portions of the Software.
//
// THE SOFTWARE IS PROVIDED "AS IS", WITHOUT WARRANTY OF ANY KIND, EXPRESS OR
// IMPLIED, INCLUDING BUT NOT LIMITED TO THE WARRANTIES OF MERCHANTABILITY,
// FITNESS FOR A PARTICULAR PURPOSE AND NONINFRINGEMENT. IN NO EVENT SHALL THE
// AUTHORS OR COPYRIGHT HOLDERS BE LIABLE FOR ANY CLAIM, DAMAGES OR OTHER
// LIABILITY, WHETHER IN AN ACTION OF CONTRACT, TORT OR OTHERWISE, ARISING FROM,
// OUT OF OR IN CONNECTION WITH THE SOFTWARE OR THE USE OR OTHER DEALINGS IN
// THE SOFTWARE.

/**
 * Smoothie Charts - http://smoothiecharts.org/
 * (c) 2010-2012, Joe Walnes
 *
 * v1.0: Main charting library, by Joe Walnes
 * v1.1: Auto scaling of axis, by Neil Dunn
 * v1.2: fps (frames per second) option, by Mathias Petterson
 * v1.3: Fix for divide by zero, by Paul Nikitochkin
 * v1.4: Set minimum, top-scale padding, remove timeseries, add optional timer to reset bounds, by Kelley Reynolds
 * v1.5: Set default frames per second to 50... smoother.
 *       .start(), .stop() methods for conserving CPU, by Dmitry Vyal
 *       options.iterpolation = 'bezier' or 'line', by Dmitry Vyal
 *       options.maxValue to fix scale, by Dmitry Vyal
 * v1.6: minValue/maxValue will always get converted to floats, by Przemek Matylla
 * v1.7: options.grid.fillStyle may be a transparent color, by Dmitry A. Shashkin
 *       Smooth rescaling, by Kostas Michalopoulos
 */

function TimeSeries(options) {
  options = options || {};
  options.resetBoundsInterval = options.resetBoundsInterval || 3000; // Reset the max/min bounds after this many milliseconds
  options.resetBounds = options.resetBounds || true; // Enable or disable the resetBounds timer
  this.options = options;
  this.data = [];
  
  this.maxValue = Number.NaN; // The maximum value ever seen in this time series.
  this.minValue = Number.NaN; // The minimum value ever seen in this time series.

  // Start a resetBounds Interval timer desired
  if (options.resetBounds) {
    this.boundsTimer = setInterval(function(thisObj) { thisObj.resetBounds(); }, options.resetBoundsInterval, this);
  }
}

// Reset the min and max for this timeseries so the graph rescales itself
TimeSeries.prototype.resetBounds = function() {
  this.maxValue = Number.NaN;
  this.minValue = Number.NaN;
  for (var i = 0; i < this.data.length; i++) {
    this.maxValue = !isNaN(this.maxValue) ? Math.max(this.maxValue, this.data[i][1]) : this.data[i][1];
    this.minValue = !isNaN(this.minValue) ? Math.min(this.minValue, this.data[i][1]) : this.data[i][1];
  }
};

TimeSeries.prototype.append = function(timestamp, value) {
  this.data.push([timestamp, value]);
  this.maxValue = !isNaN(this.maxValue) ? Math.max(this.maxValue, value) : value;
  this.minValue = !isNaN(this.minValue) ? Math.min(this.minValue, value) : value;
};

function SmoothieChart(options) {
  // Defaults
  options = options || {};
  options.grid = options.grid || { fillStyle:'#000000', strokeStyle: '#777777', lineWidth: 1, millisPerLine: 1000, verticalSections: 2 };
  options.millisPerPixel = options.millisPerPixel || 20;
  options.fps = options.fps || 50;
  options.maxValueScale = options.maxValueScale || 1;
  options.minValue = options.minValue;
  options.maxValue = options.maxValue;
  options.labels = options.labels || { fillStyle:'#ffffff' };
  options.interpolation = options.interpolation || "bezier";
  options.scaleSmoothing = options.scaleSmoothing || 0.125;
  this.options = options;
  this.seriesSet = [];
  this.currentValueRange = 1;
  this.currentVisMinValue = 0;
}

SmoothieChart.prototype.addTimeSeries = function(timeSeries, options) {
  this.seriesSet.push({timeSeries: timeSeries, options: options || {}});
};

SmoothieChart.prototype.removeTimeSeries = function(timeSeries) {
    this.seriesSet.splice(this.seriesSet.indexOf(timeSeries), 1);
};

SmoothieChart.prototype.streamTo = function(canvas, delay) {
  var self = this;
  this.render_on_tick = function() {
    self.render(canvas, new Date().getTime() - (delay || 0));
  };

  this.start();
};

SmoothieChart.prototype.start = function() {
  if (!this.timer)
    this.timer = setInterval(this.render_on_tick, 1000/this.options.fps);
};

SmoothieChart.prototype.stop = function() {
  if (this.timer) {
    clearInterval(this.timer);
    this.timer = undefined;
  }
};

SmoothieChart.prototype.render = function(canvas, time) {
  var canvasContext = canvas.getContext("2d");
  var options = this.options;
  var dimensions = {top: 0, left: 0, width: canvas.clientWidth, height: canvas.clientHeight};

  // Save the state of the canvas context, any transformations applied in this method
  // will get removed from the stack at the end of this method when .restore() is called.
  canvasContext.save();

  // Round time down to pixel granularity, so motion appears smoother.
  time = time - time % options.millisPerPixel;

  // Move the origin.
  canvasContext.translate(dimensions.left, dimensions.top);
  
  // Create a clipped rectangle - anything we draw will be constrained to this rectangle.
  // This prevents the occasional pixels from curves near the edges overrunning and creating
  // screen cheese (that phrase should neeed no explanation).
  canvasContext.beginPath();
  canvasContext.rect(0, 0, dimensions.width, dimensions.height);
  canvasContext.clip();

  // Clear the working area.
  canvasContext.save();
  canvasContext.fillStyle = options.grid.fillStyle;
  canvasContext.clearRect(0, 0, dimensions.width, dimensions.height);
  canvasContext.fillRect(0, 0, dimensions.width, dimensions.height);
  canvasContext.restore();

  // Grid lines....
  canvasContext.save();
  canvasContext.lineWidth = options.grid.lineWidth || 1;
  canvasContext.strokeStyle = options.grid.strokeStyle || '#ffffff';
  canvasContext.fillStyle = options.labels.fillStyle;    //added by nick  
  // Vertical (time) dividers.
  if (options.grid.millisPerLine > 0) {
    for (var t = time - (time % options.grid.millisPerLine); t >= time - (dimensions.width * options.millisPerPixel); t -= options.grid.millisPerLine) {
      canvasContext.beginPath();
      var gx = Math.round(dimensions.width - ((time - t) / options.millisPerPixel));
      canvasContext.moveTo(gx, 0);
      canvasContext.lineTo(gx, dimensions.height);
      canvasContext.stroke();
      /********************************/
      /*    added by nick so we can    see    */
      /*    some time scale                            */
      /********************************/
      var tx=new Date(t);
        
        hours=tx.getHours();
        minutes=tx.getMinutes();
        seconds=tx.getSeconds();
        
        if(tx.getHours()<10){
            hours="0" + tx.getHours();    
        }else{
            hours=tx.getHours();
        }
        
        if(tx.getMinutes()<10){
            minutes="0" + tx.getMinutes();    
        }else{
            minutes=tx.getMinutes();
        }
        
        if(tx.getSeconds()<10){
            seconds="0" + tx.getSeconds();    
        }else{
            seconds=tx.getSeconds();
        }
        
        var ts=hours+':'+minutes+':'+seconds;
      //var ts=tx.getHours()+':'+tx.getMinutes()+':'+tx.getSeconds();
      canvasContext.fillText(ts, gx-(canvasContext.measureText(ts).width / 2), dimensions.height-10);
      /***********************************/      
      canvasContext.closePath();
    }
  }

  // Horizontal (value) dividers.
  for (var v = 1; v < options.grid.verticalSections; v++) {
    var gy = Math.round(v * dimensions.height / options.grid.verticalSections);
    var ty = parseFloat(options.maxValue*(v/options.grid.verticalSections)).toFixed(2);    //added by nick    
    canvasContext.beginPath();
    canvasContext.moveTo(0, gy);
    canvasContext.lineTo(dimensions.width, gy);
    canvasContext.stroke();
    canvasContext.fillText(ty, dimensions.width - canvasContext.measureText(ty).width - 2, dimensions.height-gy);    //added by nick
    canvasContext.closePath();
  }
  // Bounding rectangle.
  canvasContext.beginPath();
  canvasContext.strokeRect(0, 0, dimensions.width, dimensions.height);
  canvasContext.closePath();
  canvasContext.restore();

  // Calculate the current scale of the chart, from all time series.
  var maxValue = Number.NaN;
  var minValue = Number.NaN;

  for (var d = 0; d < this.seriesSet.length; d++) {
      // TODO(ndunn): We could calculate / track these values as they stream in.
      var timeSeries = this.seriesSet[d].timeSeries;
      if (!isNaN(timeSeries.maxValue)) {
          maxValue = !isNaN(maxValue) ? Math.max(maxValue, timeSeries.maxValue) : timeSeries.maxValue;
      }

      if (!isNaN(timeSeries.minValue)) {
          minValue = !isNaN(minValue) ? Math.min(minValue, timeSeries.minValue) : timeSeries.minValue;
      }
  }

  if (isNaN(maxValue) && isNaN(minValue)) {
      return;
  }

  // Scale the maxValue to add padding at the top if required
  if (options.maxValue != null)
    maxValue = options.maxValue;
  else
    maxValue = maxValue * options.maxValueScale;
  // Set the minimum if we've specified one
  if (options.minValue != null)
    minValue = options.minValue;
  var targetValueRange = maxValue - minValue;
  this.currentValueRange += options.scaleSmoothing*(targetValueRange - this.currentValueRange);
  this.currentVisMinValue += options.scaleSmoothing*(minValue - this.currentVisMinValue);
  var valueRange = this.currentValueRange;
  var visMinValue = this.currentVisMinValue;

  // For each data set...
  for (var d = 0; d < this.seriesSet.length; d++) {
    canvasContext.save();
    var timeSeries = this.seriesSet[d].timeSeries;
    var dataSet = timeSeries.data;
    var seriesOptions = this.seriesSet[d].options;

    // Delete old data that's moved off the left of the chart.
    // We must always keep the last expired data point as we need this to draw the
    // line that comes into the chart, but any points prior to that can be removed.
    while (dataSet.length >= 2 && dataSet[1][0] < time - (dimensions.width * options.millisPerPixel)) {
      dataSet.splice(0, 1);
    }

    // Set style for this dataSet.
    canvasContext.lineWidth = seriesOptions.lineWidth || 1;
    canvasContext.fillStyle = seriesOptions.fillStyle;
    canvasContext.strokeStyle = seriesOptions.strokeStyle || '#ffffff';
    // Draw the line...
    canvasContext.beginPath();
    // Retain lastX, lastY for calculating the control points of bezier curves.
    var firstX = 0, lastX = 0, lastY = 0;
    for (var i = 0; i < dataSet.length; i++) {
      // TODO: Deal with dataSet.length < 2.
      var x = Math.round(dimensions.width - ((time - dataSet[i][0]) / options.millisPerPixel));
      var value = dataSet[i][1];
      var offset = value - visMinValue;
      var scaledValue = dimensions.height - (valueRange ? Math.round((offset / valueRange) * dimensions.height) : 0);
      var y = Math.max(Math.min(scaledValue, dimensions.height - 1), 1); // Ensure line is always on chart.

      if (i == 0) {
        firstX = x;
        canvasContext.moveTo(x, y);
      }
      // Great explanation of Bezier curves: http://en.wikipedia.org/wiki/B�zier_curve#Quadratic_curves
      //
      // Assuming A was the last point in the line plotted and B is the new point,
      // we draw a curve with control points P and Q as below.
      //
      // A---P
      //     |
      //     |
      //     |
      //     Q---B
      //
      // Importantly, A and P are at the same y coordinate, as are B and Q. This is
      // so adjacent curves appear to flow as one.
      //
      else {
        switch (options.interpolation) {
        case "line":
          canvasContext.lineTo(x,y);
          break;
        case "bezier":
        default:
          canvasContext.bezierCurveTo( // startPoint (A) is implicit from last iteration of loop
            Math.round((lastX + x) / 2), lastY, // controlPoint1 (P)
            Math.round((lastX + x)) / 2, y, // controlPoint2 (Q)
            x, y); // endPoint (B)
          break;
        }
      }

      lastX = x, lastY = y;
    }
    if (dataSet.length > 0 && seriesOptions.fillStyle) {
      // Close up the fill region.
      canvasContext.lineTo(dimensions.width + seriesOptions.lineWidth + 1, lastY);
      canvasContext.lineTo(dimensions.width + seriesOptions.lineWidth + 1, dimensions.height + seriesOptions.lineWidth + 1);
      canvasContext.lineTo(firstX, dimensions.height + seriesOptions.lineWidth);
      canvasContext.fill();
    }
    canvasContext.stroke();
    canvasContext.closePath();
    canvasContext.restore();
  }

  // Draw the axis values on the chart.
  if (!options.labels.disabled) {
      canvasContext.fillStyle = options.labels.fillStyle;
      var maxValueString = parseFloat(maxValue).toFixed(2);
      var minValueString = parseFloat(minValue).toFixed(2);
      canvasContext.fillText(maxValueString, dimensions.width - canvasContext.measureText(maxValueString).width - 2, 10);
      canvasContext.fillText(minValueString, dimensions.width - canvasContext.measureText(minValueString).width - 2, dimensions.height - 2);
  }

  canvasContext.restore(); // See .save() above.
}


Now for the page that has your graph on it.
You can add titles and usual web page text around the graph as you require.
In my case I called this page graph.php


<!DOCTYPE html>
<html>
<head>
  <meta http-equiv="Content-Type" content="text/html; charset=utf-8" />
  <title>Power graph. Smooth history.</title>
<script type="text/javascript" src="smoothie.js"></script>
<script type="text/javascript">
var line = new TimeSeries();
var xmlhttp;
var tablename=1;        //keep to one so that we only get one value after the inital update
var chart = new SmoothieChart( {fps:15, labels:{fillStyle:'#ffffff'}, minValue: 0, maxValue: 5, millisPerPixel: 1000, grid: {fillStyle:'#000000',  strokeStyle: '#dddddd', lineWidth: 1, millisPerLine: 60000, verticalSections: 5 } } );

function initGraph()
{
        chart.addTimeSeries(line, { strokeStyle: 'rgba(0, 255, 0, 1)', fillStyle: 'rgba(0, 255, 0, 0.2)', lineWidth: 2 });
        chart.streamTo(document.getElementById("chart"), 3000);
}

function updatedata(data)
{
        var x=new Array();
        //split the data string into the array
        x=data.split("|");

        //ok now lets get the time and now start unloading the data to the smoothie
        var d=new Date().getTime();

        //check to see if we have an array of data or not. if not then just append the single line
        if (x.length > 1)
        {
                for (var i=x.length - 1;i!=0;i--)
                {
                        line.append(d - (60000*i), x[i]);       //write the data to the graph with an offset of 5secs*i
                }
        }
        else
        {
                line.append(d, x[0]);   //just append the line
                 }
}

//here is the stuff for doing the ajax call
function getQuery(samples)

{
        //create the xmlhttpobject
        xmlhttp=GetXmlHttpObject();
        if (xmlhttp==null)
        {
          alert ("Your browser does not support XMLHTTP!");
          return;
        }
        var url="smooth.php";
        if ((samples!=null && samples!=""))
        {
                url=url+"?samples=" + samples;
        }
        xmlhttp.onreadystatechange=stateChanged;
        xmlhttp.open("GET",url,true);
        xmlhttp.setRequestHeader("Content-Type", "text/html");
        xmlhttp.send(null);
        //set the refresh
        setTimeout('getQuery(tablename)',5000);
}

function GetXmlHttpObject()
{
if (window.XMLHttpRequest)
  {
  // code for IE7+, Firefox, Chrome, Opera, Safari
  return new XMLHttpRequest();
  }
if (window.ActiveXObject)
  {
  // code for IE6, IE5
  return new ActiveXObject("Microsoft.XMLHTTP");
  }
return null;
}

function stateChanged()
{
        if (xmlhttp.readyState==4)
  {
                updatedata(xmlhttp.responseText);       //update the data for the trend
  }
}

setInterval(function() {
var el=document.getElementById("maxval");
el.innerHTML=Math.ceil(line.maxValue);
el=document.getElementById("minval");
el.innerHTML=line.minValue | 0;
//xscale();
var c=document.getElementById("chart");
var w=c.width;
var mspl=chart.options.grid.millisPerLine;
var mspp=chart.options.millisPerPixel;
var lpc=(w*mspp)/mspl;
if(document.getElementById("fps")){
        el=document.getElementById("fps");
        el.innerHTML=lpc;
}
}, 1000);

function writeScale(val){
chart.options.maxValue=val;
}

function writeMinScale(val){
chart.options.minValue=val;
}

function changeTimeScale(val){
//get width of canvas
var c=document.getElementById("chart");
var w=c.width;
//get how many divisions there are
var mspl=chart.options.grid.millisPerLine;
var mspp=chart.options.millisPerPixel;
var lpc=(w*mspp)/mspl;

//figure out time scale
var x=(val*60);
x=Math.ceil(x);
chart.options.millisPerPixel=(x/w)*1000;

chart.options.grid.millisPerLine=(w*chart.options.millisPerPixel)/lpc;
//chart.options.fps=50/val;     //??
}

function changeCurrentChart(timespan){
        chart.removeTimeSeries(line);
        line = new TimeSeries();
        changeTimeScale(timespan);
        getQuery(timespan);
        chart.addTimeSeries(line, { strokeStyle: 'rgba(0, 255,0, 1)', fillStyle: 'rgba(0, 255, 0, 0.2)', lineWidth: 2 });
        chart.streamTo(document.getElementById("chart"), 3000);
}

</script>
</head>
<body onLoad="initGraph();getQuery('11')">

<canvas id="chart" width="600" height="300"></canvas>

Change the max x-scale:
<select onChange="writeScale(this.value);">
<option value="10" selected="selected">10</option>
<option value="5">5</option>
<option value="2">2</option>
<option value="1">1</option>
</select>
</div>
Timespan:
<select onChange="changeCurrentChart(this.value)">
<option value="11" selected="selected">10 Minute</option>
<option value="61">60 Minute</option>
<option value="1441">24 Hour</option>
</select>
</div>
</body>
</html>


To test it, just browse to the url of the page.
This will give you a 10 minute, 1 hour and 24 hour graph (assuming your MySQL has that much data in it).
If you change the size of the graph, you will have to do the math to work out the new pixels per mm to make it work again.

This style graph can be tweaked to run without having to get its data from a database.
In this case, its just live data that builds up once you visit the web page… Why would you want to do this? Because then you can have the page generated from the controller.

Yeah. Its pretty mad cool.

If you would like to see an example of the modified smoothie chart that Ben mentions above, check out the demo site I have. http://22solutions.homeip.net:8080. Browse to the hot water page or the electricity page and view history. It shows both a live graph and a ‘historic’ graph example.
If you inspect the code, it might be a little difficult to follow as I have OPTOmized it to be efficient by not calling on scripts every time a page is loaded (as it runs from the controller as Ben mentioned above). To get the full page of code you have to combine the index.html page and the pages it calls behind the scenes. Firefox and firebug should reveal all.

Dear Sir,

Your link at homip is not working. Do you have another link? Otherwise, can you publish your code?

Thanks a lot,

Jon

Thanks guys, fixed. You should be able to view he site in all it’s glory!
Nick