I’m just full of questions tonight, it seems.
We often have process variables whose full-scale ends up being less than 1. Examples are chlorine concentrations or turbidities in drinking water.
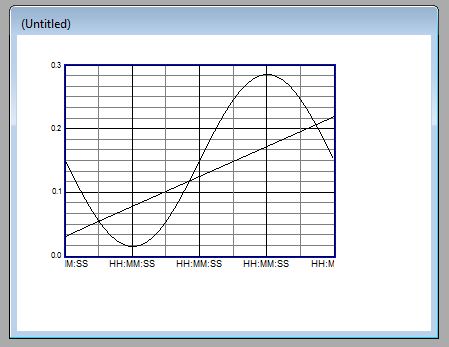
In PAC Display, I can’t find a convenient way to set up graphs (trends or supertrends) that have a full-scale range that is a non-integer.
An example is turbidity of finished water leaving filters. We want to have graphs scaled from 0 to 0.3 NTU (nephelometric turbidity units) so that we can easily see the useful range. 0.3 NTU is the maximum turbidity allowed by EPA regulations, for example. So what I’ve done is to invent a new unit of turbidity, and called it the “milli-NTU”, then created new variables in the strategy with the data scaled up so that 0 to 0.3NTU is now 0 to 300 “milli-NTU”, and finally I display this value on the graphs, which works just fine, but always gets a laugh from the water treatment plant operators.
It’s hard to explain to them that the software simply does not allow for non-integer “top of scale” values in the graphs.
Is there a cleaner way to achieve this? I suspect I’m missing something obvious, but I can’t figure out how to set up the vertical scale of a trend to be anything but an integer.
Thanks again, everyone. This forum is very handy!